 Earn with Nexo

ETH / USD Price Analysis: Bearish Inertia
Ethereum has a negative-to-neutral outlook as it continues on its bearish pattern. Bulls will need to work hard on this pair.
- Ethereum has a neutral short-term trading bias, with the ETH / USD pair testing back towards its 200-period moving average on the four-hour time frame
- ETH still retains its bullish medium-term trading bias
- Buyers now need to move price above the April trading high or ETH / USD could come under downside pressure
Ethereum / USD Short-term price analysis
ETH has a neutral short-term trading bias, with the cryptocurrency falling back towards its 200-period moving average on the four-hour time frame.
The four-hour time frame continues to show a valid head and shoulders pattern, with bulls failing to negate the bearish pattern during the latest rally in the ETH / USD pair.
Technical indicators have turned bearish on the four-hour time frame and are currently generating sell signals.
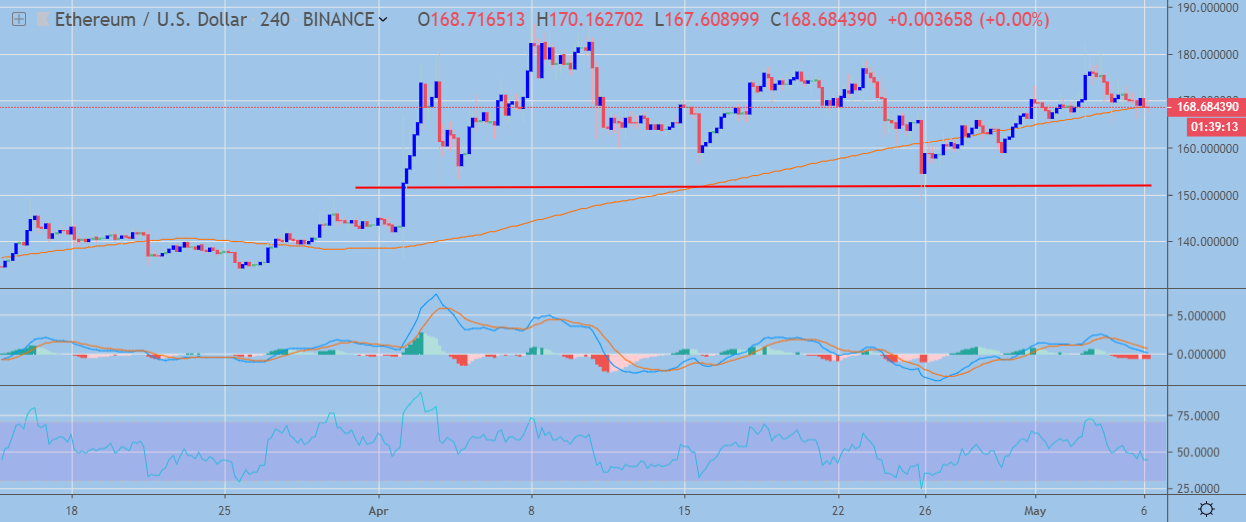 ETH / USD H4 Chart by TradingView
Pattern Watch
Traders should note that a bullish inverted head and shoulders pattern will form on the four-hour time frame if the ETH / USD pair advances towards its current yearly trading high.
Relative Strength Index
The RSI indicator on the four-hour time frame has also turned bearish and shows scope for further downside.
MACD Indicator
The MACD indicator on the four-hour time frame has turned bearish, with the MACD signal line now issuing a sell signal.
Ethereum / USD Medium-term price analysis
ETH retains a bullish medium-term bias, with the ETH / USD pair still trading well above its key 200-day moving average.
The daily time frame is showing a small inverted head and shoulders pattern in play, while an even larger inverted head and shoulders pattern could take shape if the ETH / USD pair moves above the $200.00 level.
Technical indicators on the daily time frame currently have a slight bullish bias, although downside pressures are building.
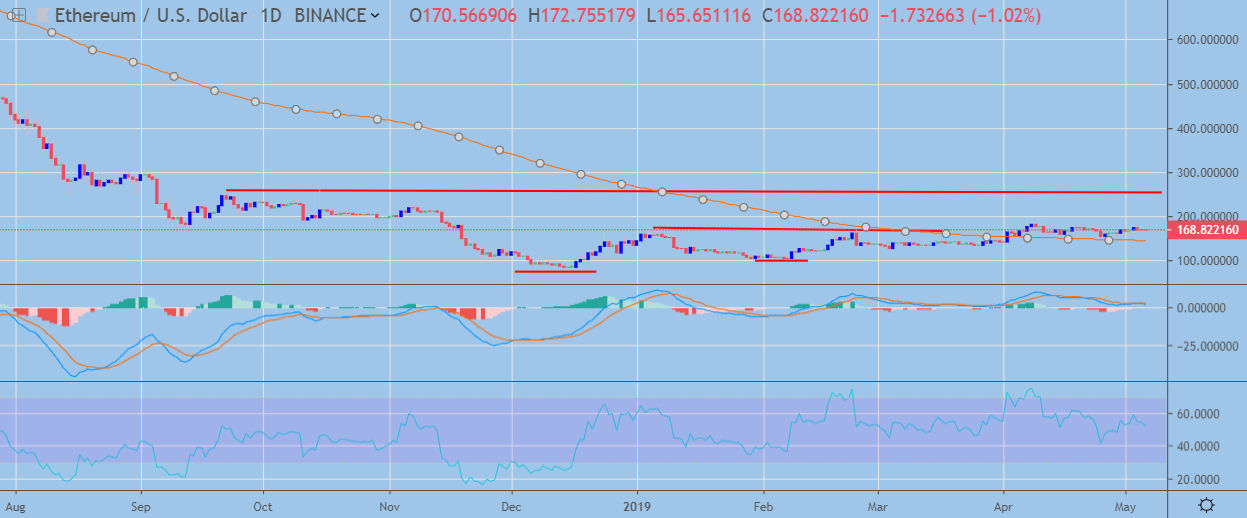 ETH / USD Daily Chart by TradingView
Pattern Watch
Traders should note that critical weekly support for the ETH / USD pair is currently located at the $150.00 level.
Relative Strength Index
The RSI Indicator on the daily time frame remains bullish, although downside pressures are building.
MACD Indicator
The MACD indicator on the daily time frame is neutral, with the MACD histogram and the MACD signal line failing to issue clear trading signals.
Conclusion
ETH is coming under downside pressure in the near-term after bulls failed to rally the ETH / USD pair to a fresh 2019 trading high during last week rally.
Bulls must start to make new higher price highs and force the cryptocurrency above the $200.00 level or the bearish pattern on the four-hour time frame could soon be triggered into action.
Check out our Ethereum coin guide here.