
Ethereum Price Analysis ETH / USD: Crisis Averted, $500 Target
Ethereum has avoided the dark side and is drifting back upwards.
- Ethereum has a bullish short-term trading bias, with the ETH / USD pair testing towards key upside resistance
- The four-hour time frame continues to show a valid bearish head and shoulders pattern
- The daily time frame shows a large bullish pattern with an upside target close to the $500.00 level
Ethereum / USD Short-term price analysis
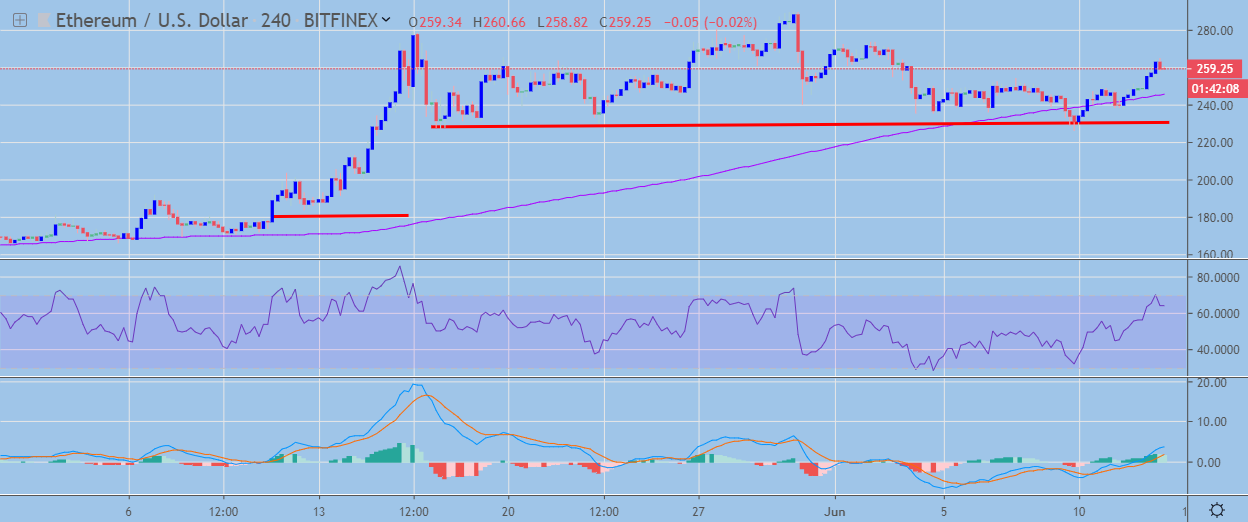
Ethereum has a bullish short-term trading bias, with the cryptocurrency recovering back towards critical resistance on the four-hour time frame.
The four-hour time frame shows that a bearish head and shoulders pattern is close to completion, with ETH / USD bulls working hard to invalidate the bearish pattern.
Technical indicators across the four-hour time frame have turned bullish and continue to issue a buy signal.
Pattern Watch
Traders should note that if the bearish head and shoulders pattern is invalidated the ETH / USD pair could start to target towards the $330.00 level.
Relative Strength Index
The RSI indicator on the four-hour time frame is bullish, although it is now approaching overbought territory.
MACD Indicator
The MACD indicator on the four-hour time frame is bullish and continues to issue a strong buy signal.
Ethereum / USD Medium-term price analysis
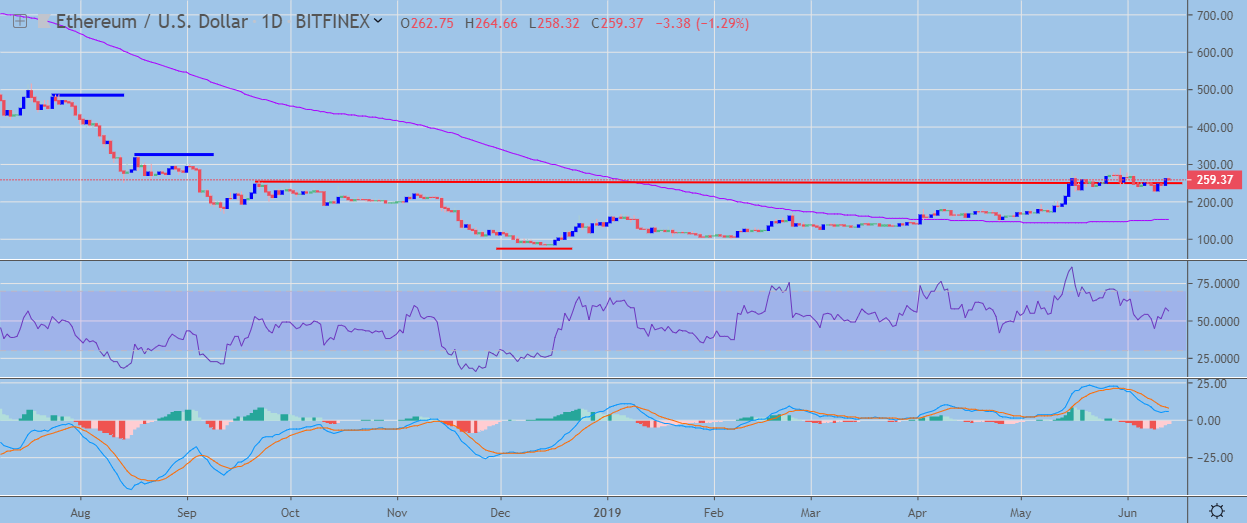
Ethereum still has a bullish medium-term trading outlook, with the ETH / USD pair testing towards major trendline resistance on the daily time frame.
The daily time frame continues to show a valid inverted head and shoulders pattern, with the upside projection of the bullish pattern located close to the $500.00 level.
Technical indicators on the daily time frame are mixed and are currently failing to issue a conclusive trading signal.
Pattern Watch
Traders should note that the daily time frame shows that the $325.00 levels offers the strongest form of technical resistance above the $300.00 level.
Relative Strength Index
The RSI indicator is attempting to turn bullish on the daily time frame as medium-term upside pressure once again starts to build.
MACD Indicator
The MACD indicator on the daily time frame is conflicted and is failing to issue a clear trading signal.
Conclusion
Ethereum has staged a strong recovery from neckline support on the four-hour time frame, with bulls now needing to breach the $280.00 level to negate short-term bearish pressure.
The daily time frame continues to show the $500.00 level as a valid upside target, with the $325.00 level offering interim resistance if a technical breakout occurs above the $300.00 level.
Check out our introductory guide to Ethereum.