
Ethereum Price Analysis ETH / USD: Extensive Losses
Breaking the $200 support barrier has caused a strong decline.
- Ethereum has a bearish short-term bias, with the ETH / USD pair crashing below key technical support on the four-hour time frame
- The four-hour time frame shows that the recent bearish triangle breakout has accelerated the ETH / USD pair’s decline
- The daily time frame shows that the bearish head and shoulders pattern is close to reaching its downside objective
Ethereum / USD Short-term price analysis
Ethereum has a bearish short-term trading bias, with the cryptocurrency tumbling below key technical support on the four-hour time frame.
The four-hour time frame shows that the ETH / USD pair has experienced a sharp sell-off after breaking under a triangle pattern with a $40.00 downside projection.
Technical indicators on the four-hour time frame are heavily bearish and continue to issue a sell signal.
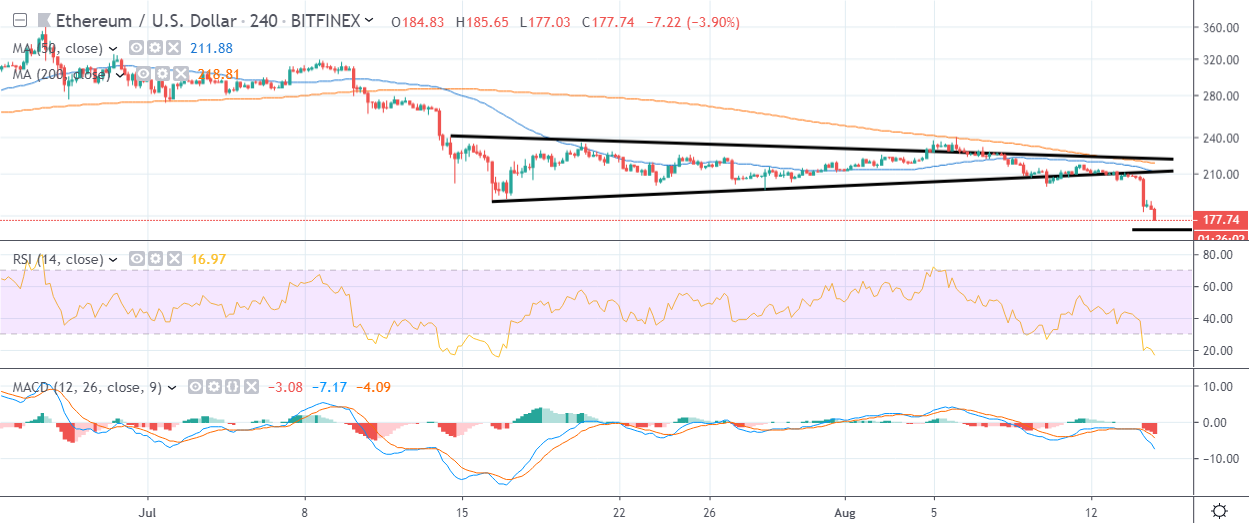
Pattern Watch
Traders should note that the recent decline has also helped to shape a bearish head and shoulders pattern.
Relative Strength Index
The RSI indicator on the four-hour time frame has a bearish bias and highlights the growing bearish short-term pressure.
MACD Indicator
The MACD indicator on the four-hour time frame is bearish and continues to issue a sell signal.
Ethereum / USD Medium-term price analysis
Ethereum has a bearish medium-term trading bias, with the ETH / USD pair trading below its trend defining 200-day moving average for the first time since April this year.
The daily time frame is showing that a head and shoulders pattern is currently in play, with the bearish pattern placing heavy technical pressure on the ETH / USD pair.
Critical technical resistance on the daily time frame is located at the $170.00 and $160.00 levels.
Technical indicators on the daily time frame have now turned heavily bearish.
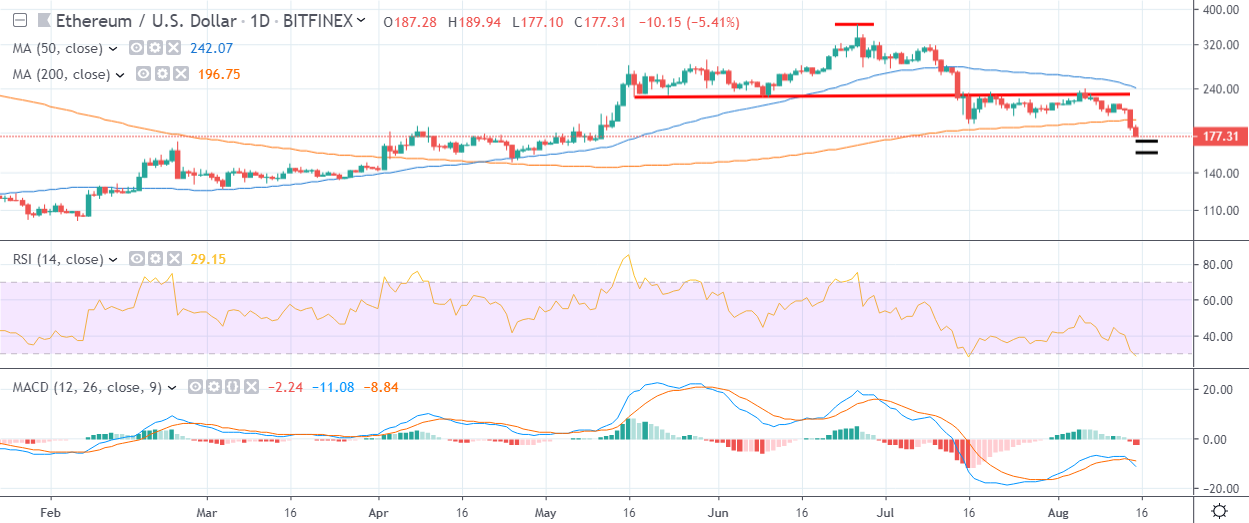
Pattern Watch
Traders should note that the bearish head and shoulders pattern on the daily time frame has an overall downside objective that would take the ETH / USD pair towards the $100.00 level.
Relative Strength Index
The RSI indicator on the daily time frame is bearish and continues to issue a sell signal.
MACD Indicator
The MACD indicator on the daily time frame is turning lower and is currently issuing a strong sell signal.
Conclusion
Ethereum selling has picked up significantly after the second-largest cryptocurrency broke through the $200.00 support barrier.
The four-hour time frame suggests the decline could reach the $170.00 level, while the daily time frame points to ETH / USD losses extending towards the $100.00 level.
Check out our introductory guide to Ethereum.