 Earn with Nexo

Ethereum Price Analysis ETH / USD: Short Term vs Long Term Pressure
Ethereum has seen a sharp reversal - but long-term prospects are improving.
- Ethereum has a bullish short-term trading bias, with the ETH / USD pair still holding above major support on the four-hour time frame
- The four-hour time frame shows that the bullish invalidation target has been fully achieved
- The daily time frame shows that the recent rally has created an even larger bullish pattern, suggesting upside potential increasing to $600.00
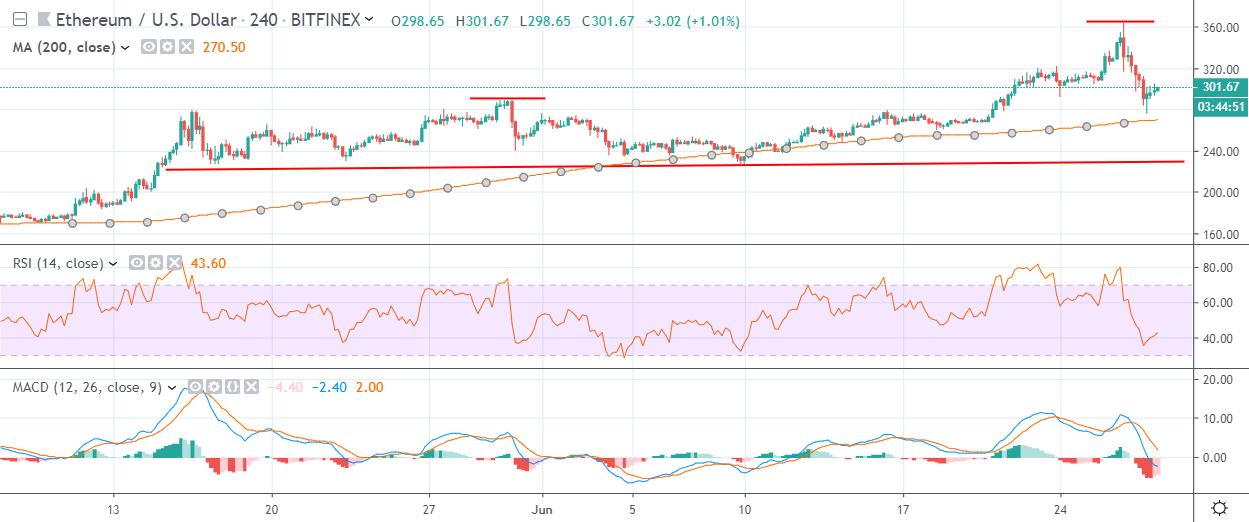
Ethereum / USD Short-term price analysis
Ethereum has a bullish short-term outlook, with the cryptocurrency testing still holding above critical support on the four-hour time frame.
The four-hour time frame shows that the bullish target of the invalidated head and shoulders pattern has now been reached, with the ETH / USD pair moving sharply lower since achieving its upside objective.
Technical indicators across the four-hour time frame continue to generate a bearish signal.
Pattern Watch
Traders should note that a bearish head and shoulders pattern could start to form on the four-hour time frame.
Relative Strength Index
The RSI indicator on the four-hour time frame is bearish and has yet to reach fully oversold conditions.
MACD Indicator
The MACD indicator on the four-hour time frame is bearish and continues to issue a sell signal.
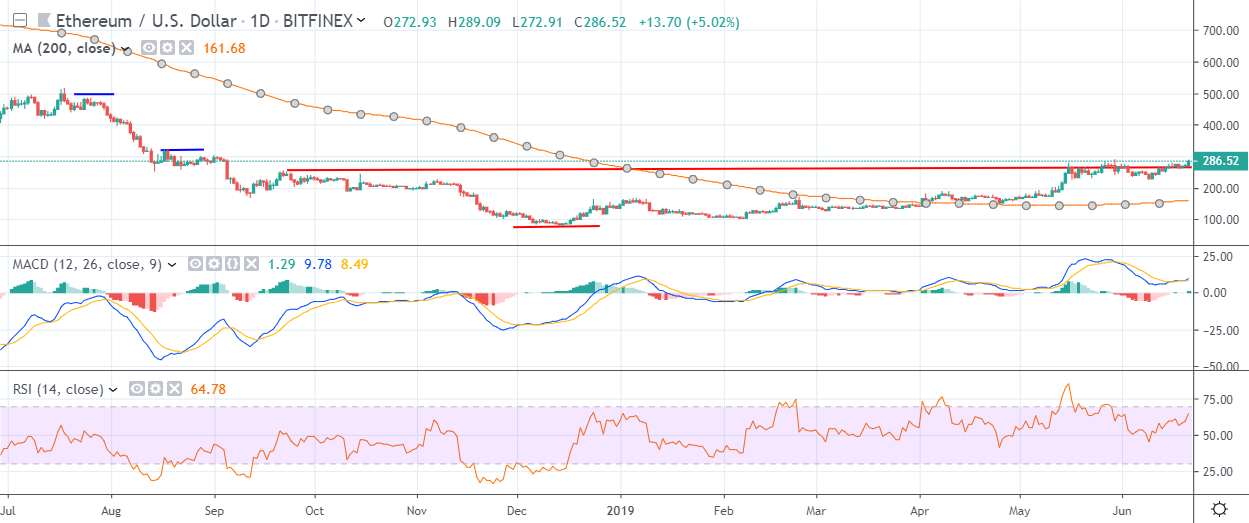
Ethereum / USD Medium-term price analysis
Ethereum has a bullish medium-term trading outlook, with the ETH / USD still holding price above major technical support on the daily time frame.
The daily time frame shows that the recent advance in the ETH / USD pair has created an even larger bullish pattern, with the cryptocurrency slipping back under the neckline of the newly created pattern.
Technical indicators on the daily time frame remain bullish, although medium-term downside pressures are building.
Pattern Watch
Traders should note that a much larger bullish pattern with an upside target of $600.00 has now formed on the daily time frame.
Relative Strength Index
The RSI indicator is also bullish on the daily time frame and continues to hold above the neutral level.
MACD Indicator
The MACD indicator on the daily time frame remains bullish, although downside pressures are starting to build.
Conclusion
Ethereum has seen a sharp reversal since tagging the $360.00 level and reaching its upside objective on the four-hour time frame.
Continued failure to keep price above the neckline of the newly created bullish pattern on the daily time frame may see the ETH / USD pair coming under increasing near-term selling pressure below the $320.00 level.
Check out our introductory guide to Ethereum.