
Ethereum Price Analysis ETH / USD: Just One Spark To Ignite
Ethereum is verging on two separate bullish breakouts.
- Ethereum has a bullish short-term trading bias, with the ETH / USD pair testing towards the current 2019 trading high
- The four-hour time frame shows that bulls are attempting to invalidate a bearish head and shoulders pattern
- The daily time frame continues to show a large bullish pattern with an upside target close to $500.00
Ethereum / USD Short-term price analysis
Ethereum has a bullish short-term outlook, with the cryptocurrency testing back towards the current 2019 trading high.
The four-hour time frame shows that bulls are close to invalidating a head and shoulders pattern and are attempting to trigger a major technical breakout above the $290.00 level.
Technical indicators across the four-hour time frame have turned bullish and continue to issue a buy signal.
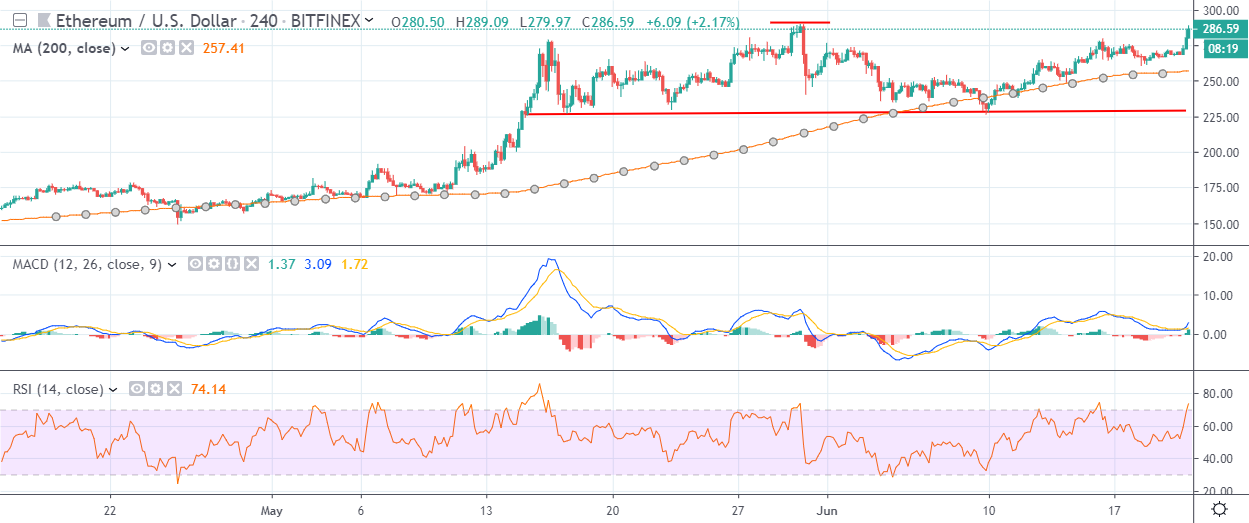
Pattern Watch
Traders should note that the invalidation target of the bearish head and shoulders pattern is located just above the $350.00 level.
Relative Strength Index
The RSI indicator on the four-hour time frame is bullish, although it has reached overbought territory.
MACD Indicator
The MACD indicator on the four-hour time frame is bullish and is starting to issue a buy signal.
Ethereum / USD Medium-term price analysis
Ethereum still has a bullish medium-term trading outlook, with the ETH / USD close to performing a confirmed technical breakout on the daily time frame.
The daily time frame continues to show that the ETH / USD pair is trading above the neckline of an inverted head and shoulders pattern, with the $500.00 level the overall bullish target.
Technical indicators on the daily time frame have turned bullish and continue to issue a buy trading signal.
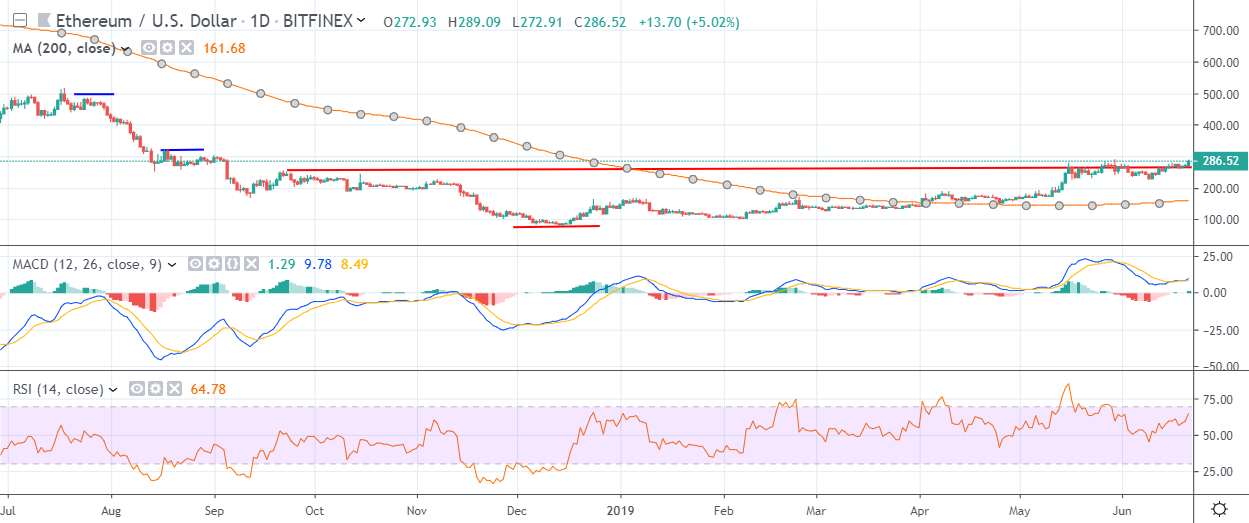
Pattern Watch
Traders should note that a much larger bullish pattern will form if the ETH / USD pair reaches the $325.00 level.
Relative Strength Index
The RSI indicator is attempting to turn bullish on the daily time frame and still shows scope for further upside.
MACD Indicator
The MACD indicator on the daily time frame is starting to turn bullish, with the MACD signal line and histogram issuing a buy signal.
Conclusion
Ethereum is close to performing a major technical breakout on both time frames, with the invalidation of the bearish pattern on the four-hour time frame likely to be a bullish catalyst.
Near-term upside targets for the ETH / USD pair range from $325.00 to $350.000, although the daily time frame highlights the $500.00 level as a major bullish target.
Check out our introductory guide to Ethereum.