 Earn with Nexo

Ethereum Price Analysis ETH / USD: Landing With A Parachute
The fall has been relatively mild compared with the market.
- Ethereum has a neutral short-term trading bias, with the ETH / USD pair approaching its 200-period moving average on the four-hour time frame
- The four-hour time frame is currently showing a valid head and shoulders pattern
- The ETH / USD pair has now moved below key neckline support on the daily time frame
Ethereum / USD Short-term price analysis
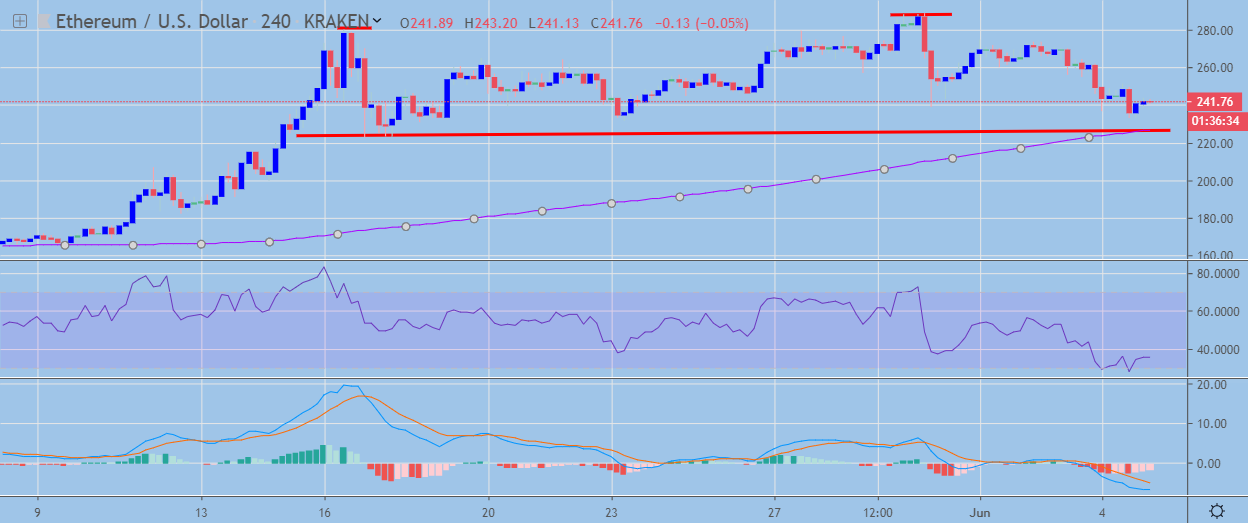
Ethereum has a neutral short-term trading bias, with the cryptocurrency falling back towards its 200-period moving average on the four-hour time frame.
The four-hour time frame shows that a head and shoulders pattern has now formed, with the ETH / USD pair trading close to the neckline of the bearish pattern.
Technical indicators across the four-hour time frame have turned bearish and continue to issue sell signals.
 ETH / USD H4 Chart by TradingView
Pattern Watch
Traders should note that a bearish head and shoulders pattern has a downside projection of around $40.00.
Relative Strength Index
The RSI indicator on the four-hour time frame remains bearish, although it has now reached oversold conditions.
MACD Indicator
The MACD indicator on the four-hour time frame is bearish and continues to issue a sell signal.
Ethereum / USD Medium-term price analysis
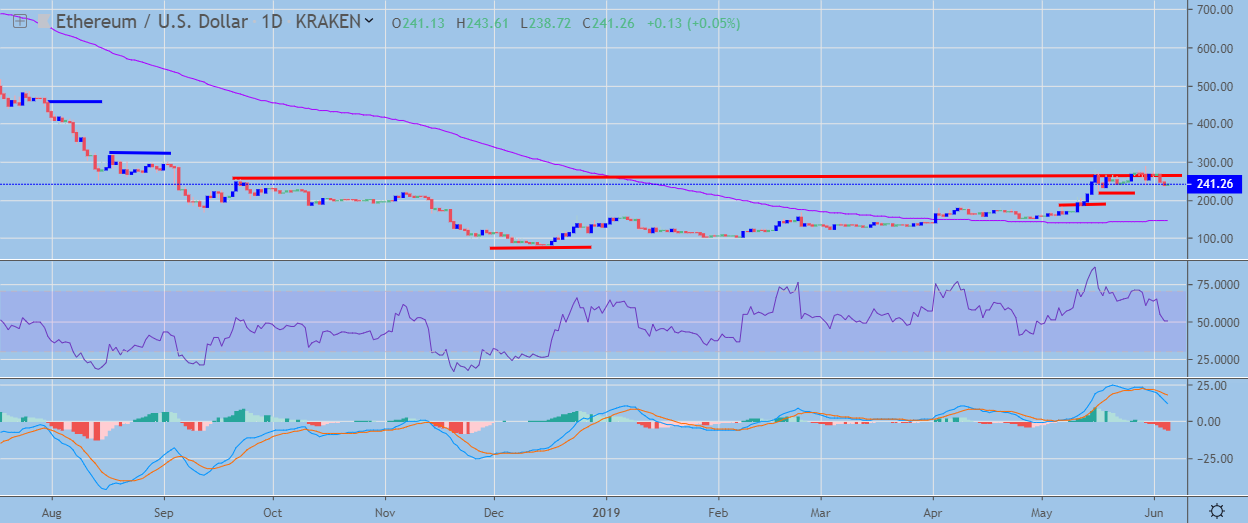
Ethereum still has a bullish medium-term trading outlook, with the ETH / USD pair still holding well above its trend defining 200-day moving average.
The daily time frame is showing that ETH / USD pair is now trading below the neckline of the large inverted head and shoulders pattern. Major technical support on the mentioned time frame is currently located at the $230.00 and $205.00 levels.
Technical indicators on the daily time frame have now turned bearish and are generating a strong sell signal.
 ETH / USD Daily Chart by TradingView
Pattern Watch
Traders should note that sellers will need to move the ETH / USD pair below the $100.00 level to invalidate the bullish inverted head and shoulders pattern on the daily time frame.
Relative Strength Index
The RSI Indicator on the daily time frame is turning lower and is now approaching neutral territory.
MACD Indicator
The MACD indicator on the daily time frame has turned bearish and is issuing a strong sell signal.
Conclusion
Ethereum is starting to follow the broader cryptocurrency downtrend, although the scale of the ETH / USD pair’s recent losses have been relatively limited so far.
The $200.00 level is the overall downside target of the bearish pattern on the four-hour time frame, while the daily time frame highlights the $230.00 level as major near-term support.
Check out our introductory guide to Ethereum.