 Earn with Nexo

Ethereum Technical Analysis: Battling For Control
ETH Technical Analysis - Bulls are winning in the short-term for both ETH / USD and ETH / BTC pairs, but more rallying is needed in the medium-term.
[vc_row][vc_column][vc_column_text]
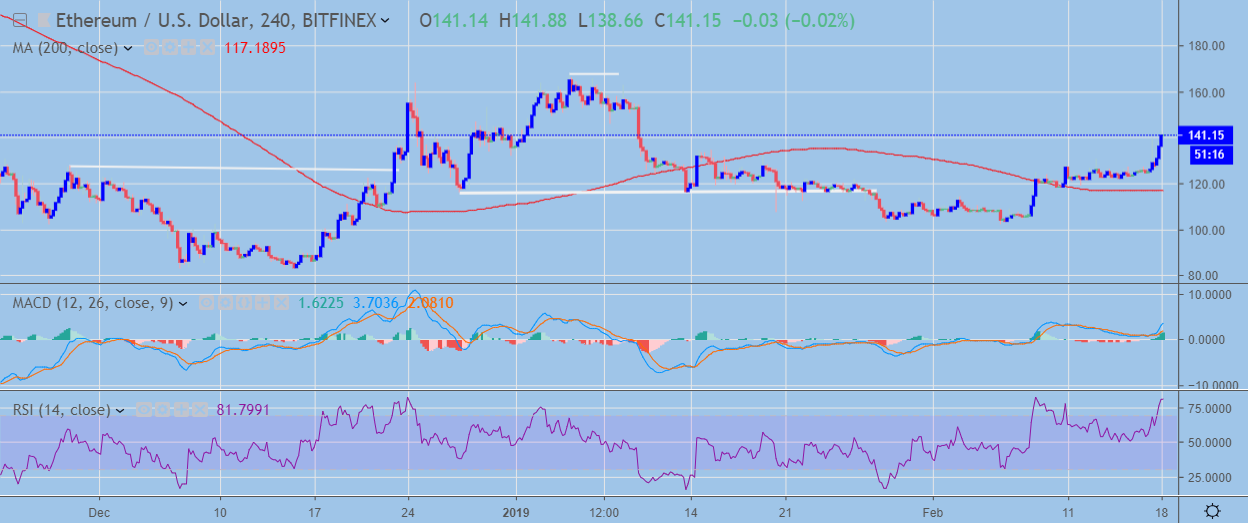
- ETH / USD is bullish in the short-term with buyers looking to target the $166.00 level
- ETH / USD pair’s Medium-term outlook remains uncertain until a series of major upside levels are breached
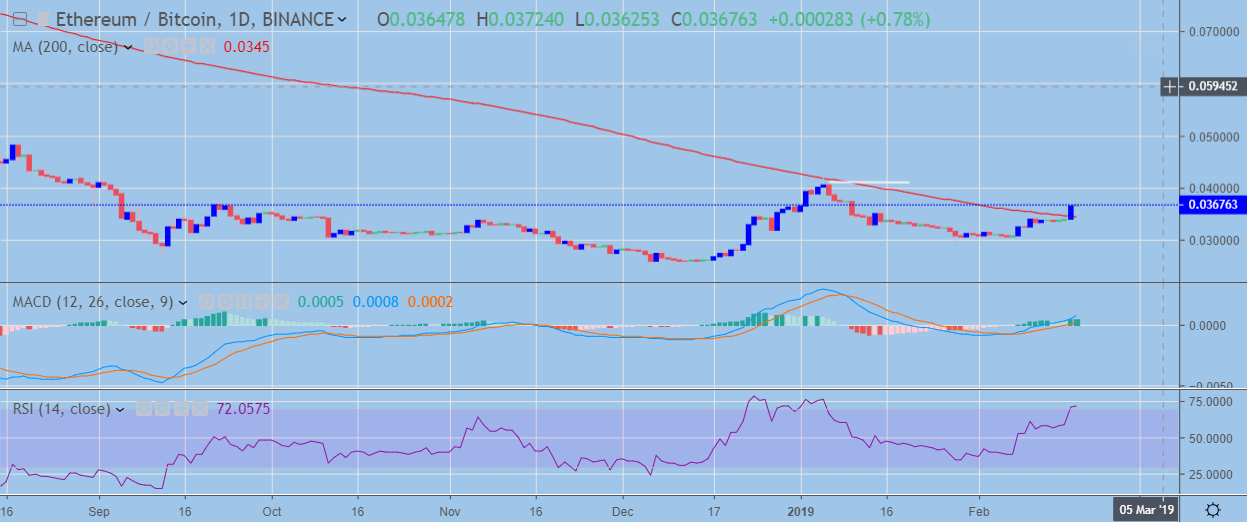
- Ethereum has turned bullish against Bitcoin, with price now trading above the pair’s 200-day moving average for the first time since June 2018
Ethereum / USD Short-term price analysis
In the short-term, the ETH / USD pair is bullish after staging a breakout rally above the $125.00 resistance level. Buyers and sellers have been battling for control of the third largest cryptocurrency, with bulls now in control of price action and attempting to negate a head and shoulders pattern on the four-hour time frame.
Traders should expect the bullish short-term bias in the ETH / USD pair to last while price trades above the $125.00 level, while the $116.00 level offers critical technical support below.
 ETH / USD H4 Chart (Source: TradingView)
Pattern Watch
Traders should watch for the bearish head and shoulders pattern on the four-hour time frame to be invalidated if the recent rally extends towards the $166.00 resistance level.
MACD Indicator
The MACD indicator on the four-hour time frame has turned bullish and is generating a strong buy signal.
RSI Indicator
The RSI indicator on the four-hour time frame has moved into extremely overbought territory and is signaling that a near-term pullback may occur.
Ethereum / USD Medium-term price analysis
Ethereum remains bearish against the US Dollar in the medium-term, with the ETH / USD pair yet to break above any major technical levels and price still trading below the pair’s 200-day moving average.
Buyers must break above the $166.00 level in order for the ETH / USD to start making bullish higher price highs and thus shift the bearish dynamic that has been underway in the pair since last summer.
The $186.00 and $230.00 levels offer the strongest forms of technical resistance if bulls can breach the $166.00 level.
 ETH / USD Daily Chart (Source: TradingView)
Pattern Watch
The daily time frame shows that the ETH / USD pair has the potential to form a large inverted head and shoulders pattern if the upside rally continues.
MACD Indicator
The MACD indicator on the daily time frame has turned bullish and shows scope for significant upside.
RSI Indicator
The Relative Strength Indicator on the mentioned time frame is currently bullish, although it has moved into overbought territory.
Conclusion
The ETH / USD pair has turned bullish in the short-term, but still retains a bearish medium-term outlook. Bulls must keep price above the $125.00 level and start to rally the pair above the $166.00 level in order to change the dynamics of the ETH / USD pair.
Ethereum / Bitcoin Short-term price analysis
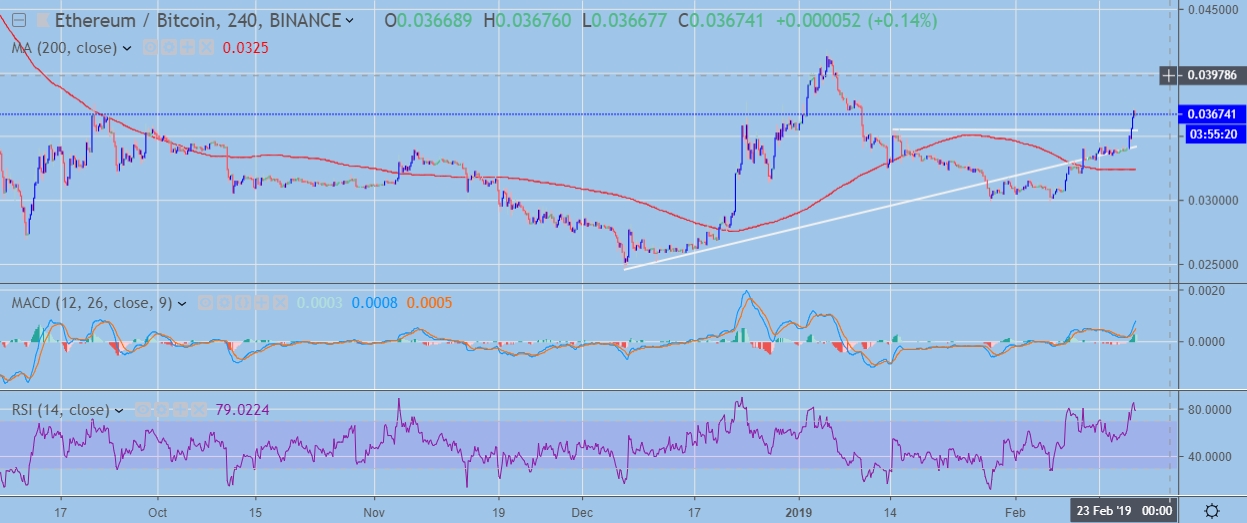
In the short-term, the ETH / BTC pair is bullish with price recently rallying towards trading levels not seen since early January.
A bullish trendline breakout has occurred on the four-hour time frame, while technical indicators are also rising alongside price.
Ethereum is trading at a critical juncture against Bitcoin, with bulls needing to move price above the pair’s current yearly trading high to negate the bearish head and shoulders pattern.
 ETH / BTC H4 Chart (Source: TradingView)
Pattern Watch
A degree of caution is still advised for traders looking to buy the pair, as a large head and shoulders pattern remains valid on the mentioned time frame.
MACD Indicator
The MACD indicator has turned bullish on the four-hour time frame.
RSI Indicator
The Relative Strength Index is bullish on the four-hour time frame although the indicator is currently overbought.
Ethereum / Bitcoin Medium-term price analysis
The ETH / BTC pair has turned bullish over the medium-horizon, with price now trading above the pair’s 200-day moving average for the first time since June last year.
If buyers can move price above the current yearly trading high, a strong rally is likely to occur as there is relatively limited technical resistance until the 0.4800 level.
A bullish double-bottom pattern formation also appears to be in place following the recent rally in the pair.
 ETH / BTC Daily Chart (Source: TradingView)
Pattern Watch
Traders should note that a large bearish head and shoulders pattern is still valid on the daily time frame.
MACD Indicator
The MACD on the daily time frame is currently generating a strong bullish signal.
RSI Indicator
The Relative Strength Index on the daily time frame has turned bullish, although similar to lower time frames the RSI indicator has moved into overbought territory.
Conclusion
Ethereum has moved above its 200-day moving average against Bitcoin for the first-time since June of last year; daily price closes now become crucial for the ETH / BTC pair. If bulls can rally price above the current yearly trading high, the ETH / BTC pair is likely to perform another strong upside move.
Decentral Media, Inc., the publisher of Crypto Briefing, is not an investment advisor and does not offer or provide investment advice or other financial advice. Nothing on this website constitutes, or should be relied on as, investment advice or financial advice of any kind. Specifically, none of the information on this website constitutes, or should be relied on as, a suggestion, offer, or other solicitation to engage in, or refrain from engaging in, any purchase, sale, or any other any investment-related activity with respect to any transaction. You should never make an investment decision on an investment based solely on the information on our website, and you should never interpret or otherwise rely on any of the information on this website as investment advice. We strongly recommend that you consult a licensed investment advisor or other qualified financial professional if you are seeking investment advice on an investment.
[/vc_column_text][/vc_column][/vc_row]