Ethereum, XRP, Litecoin Turn Bullish on Bitcoin’s Strong Performance
Investors appear to be growing optimistic about the future of the cryptocurrency market, which could lead to more upside price momentum.
The cryptocurrency market is back in the spotlight after a bullish impulse pushed up prices for most digital assets. Indicators show further upward potential for Ethereum, XRP, and Litecoin, though important resistance levels are holding them down.
Ether Faces Strong Resistance Ahead
Since the Mar. 12 crash, Ethereum has been making a series of higher highs and higher lows. The bullish momentum has taken its price up more than 117%.
The smart contract giant surged from a low of $90 to a recent high of $190.
Despite the substantial price recovery over the last month, the TD sequential indicator estimates that Ether may have more upwards potential.
This technical index presented a buy signal the moment the current green two candlestick began trading above the preceding green one candlestick. If the bullish formation is validated by a further spike in demand, ETH could enter an upward countdown all the way up to a green nine candlestick.
Such a positive scenario seems likely given the amount of interest returning to the cryptocurrency industry, especially as Bitcoin’s halving event approaches.
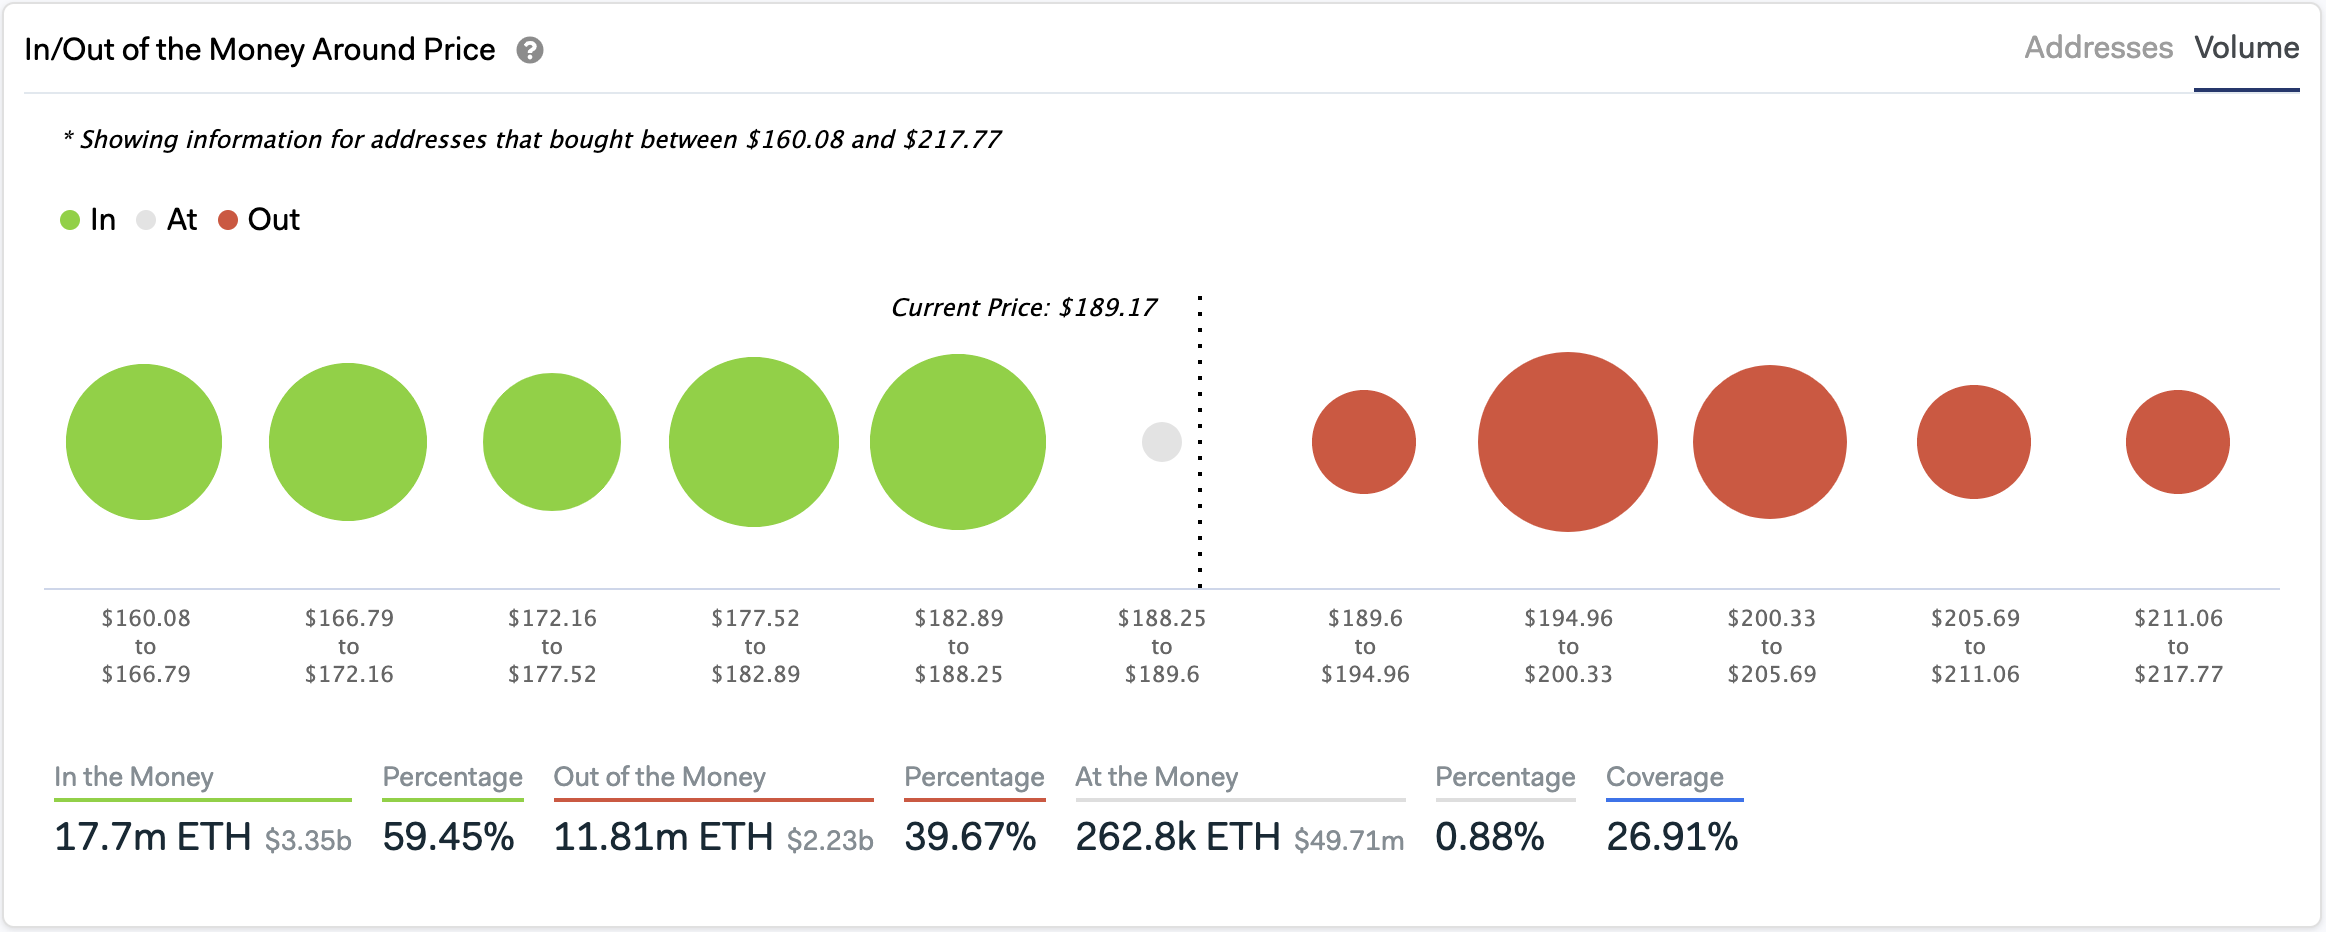
Nonetheless, IntoTheBlock’s “In/Out of the Money Around Price” model suggests that for Ether to continue reaching higher highs it would first need to move past the $200 resistance level. Approximately 1.2 million addresses bought nearly 7.8 million ETH around this price level.

An increase in the buying pressure behind Ether could allow it to break above this massive supply wall. If this happens, the bulls will likely take control of ETH’s price action, validating the outlook presented by the TD sequential indicator.
Under such circumstances, the next levels of resistance to watch out are provided by the 127.2% and 161.8% Fibonacci retracement levels. These resistance barriers sit around $223 and $260, respectively.
Although everything seems to indicate that Ethereum has more room to go up, the global economic environment tells otherwise. Thus, an important support level to pay close attention to sits around the 78.6% Fibonacci retracement level and the rising trendline.
A daily candlestick close below $172 may invalidate the bullish outlook and increase the odds of a further decline towards $155 or $142.
XRP Turns Bullish
For the first time since December 2018, the TD sequential setup suggests that it is time to buy XRP based on the 1-month chart. This technical indicator presented a bullish signal in the form of a red nine candlestick that has morphed into a green one candle due to the price action seen this month.
If May’s candlestick manages to move above April’s monthly close, the bullish formation would likely be validated. This would indicate that XRP may surge for one to four monthly candlesticks or begin a new upward countdown.
Adding credence to the bullish outlook, the parabolic stop and reverse, or “SAR,” presented a buy signal on XRP’s 1-day chart. Every time the stop and reversal points move below the price of an asset, it is considered to be a positive sign.
The parabolic SAR flip estimates that the direction of the trend for the cross-border remittances token changed from bearish to bullish.
Now, XRP would have to close above its 75-day exponential moving average to continue advancing further. By turning this resistance level into support, the odds for a move towards the 200-day exponential moving average, which sits around $0.23, increases substantially.
It is worth mentioning that XRP has been in a multi-year downtrend since the January 2018 peak. Since then, this altcoin is making a series of lower lows and lower highs. As a result, until it closes above the Feb. 15 high of $0.35, every bullish signal must be taken with caution.
Litecoin on Cusp of Major Movement
Like the altcoins previously mentioned, Litecoin is also signaling that it is ready to resume its uptrend and climb higher. However, the 50-day exponential moving average is holding strong, preventing LTC from achieving its upside potential.
Since the beginning of the month, this barrier has been able to reject the price of Litecoin twice. Considering that resistance weakens the more times it is tested, sooner or later it could turn into support.
Breaking above the 50-day exponential moving average might send LTC towards the 100 or 200-day exponential moving average. These resistance levels sit at $49 and $54, respectively.
On the downside, however, investors pay close attention to the 23.6% Fibonacci retracement level since failing to hold could jeopardize the bullish outlook.
An increase in the selling pressure behind LTC that allows it to close below this support level could trigger a sell-off among market participants. Such a bearish impulse would likely send Litecoin down to try to find support around $39.
Overall Crypto Sentiment
Regardless of the havoc that the pandemic has caused in the global financial markets, investors appear to be growing optimistic about what the cryptocurrency industry has to offer. Now, even Bloomberg analysts are bullish on Bitcoin, stating that this year it could transition toward a “quasi-currency like gold.”
The TIE has also seen an impressive rise in the number of Bitcoin tweets mentioning the halving. The cryptocurrency insights provider affirmed that “halving” mentions on Twitter surged over 63%. Meanwhile, the overall conversations on social media about BTC are up 6%.
As the block rewards reduction event approaches, the focus appears to be shifting towards Bitcoin. Nonetheless, the high levels of correlation in the cryptocurrency market suggest that an increase in the price of the flagship cryptocurrency could see the entire market following suit.
