 Earn with Nexo

IOST Price Analysis IOST / USD: Breaking Out The Wrong Way
Range-bound trading is over, though it's not much consolation.
- IOST has a bearish short-term trading bias, with the cryptocurrency dropping below major technical support on the four-hour time frame
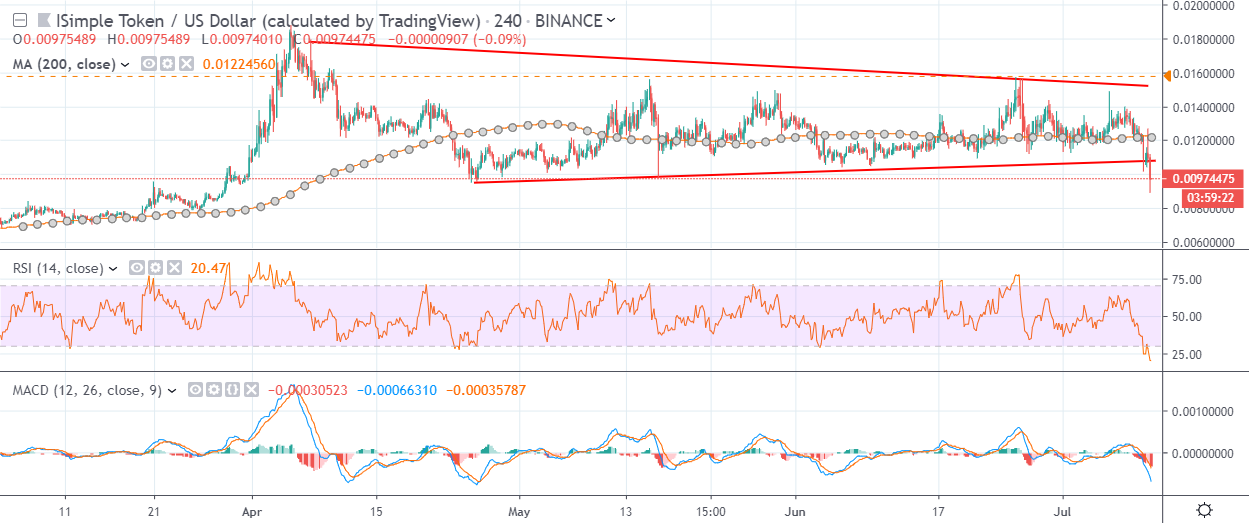
- The four-hour time frame shows that the IOST / USD pair has performed a bearish breakout under a wedge pattern
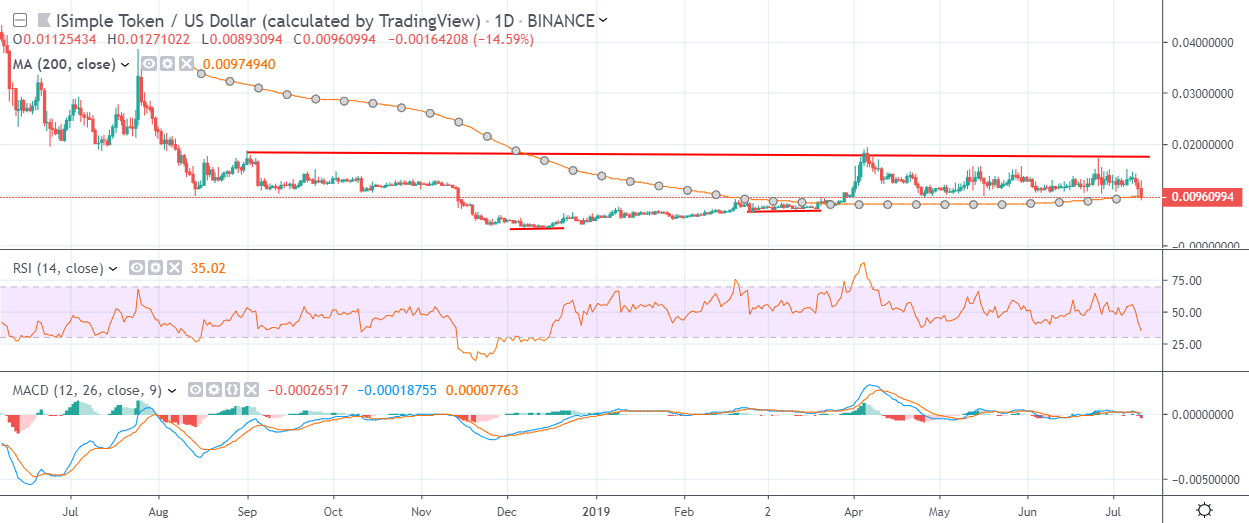
- A large inverted head and shoulders pattern continues to dominate the daily time frame
IOST / USD Short-term price analysis
IOST has a bullish short-term trading bias, with the IOST / USD pair dropping below major technical support on the four-hour time frame.
The four-hour time frame is showing a bearish technical breakout is currently underway, with the IOST / USD pair trading under a well-defined wedge pattern.
Technical indicators on the four-hour time frame are bearish and continue to issue a sell signal.
Pattern Watch
Traders should note that the downside target of the wedge pattern is located around the March 2019 trading low.
Relative Strength Index
The RSI indicator on the four-hour time frame is bearish, although it has now moved into oversold territory.
MACD Indicator
The MACD indicator on the four-hour time frame is heavily bearish, with both the MACD signal and histogram issuing strong sell signals.
IOST / USD Medium-term price analysis
IOST has a neutral medium-term outlook, with the IOST / USD pair currently testing its trend defining 200-day moving average.
The daily time frame is showing that the IOST / USD pair has fallen sharply lower, following the latest bearish rejection from the neckline of a large inverted head and shoulders pattern.
Technical indicators on the daily time frame have turned bearish and continued to issue a strong sell signal.
Pattern Watch
Traders should note that a complex inverted head and shoulders pattern may be taking shape across the daily time frame.
Relative Strength Index
The RSI on the daily time frame has turned bearish and shows scope for further downside.
MACD Indicator
The MACD indicator on the daily time frame is bearish and is currently issuing a sell signal.
Conclusion
IOST has performed a much-awaited technical breakout on the four-hour time frame, following an extended period of range trading inside a large wedge pattern.
Medium-term bulls may use a deeper pullback towards the March 2019 trading low as an opportunity to re-enter the IOST / USD long trade at a more attractive price.
Check out the IOST coin guide.