 Earn with Nexo

Litecoin Price Analysis LTC / USD: Bounce Back
LTC shows signs of recovery as it looks to bounce.
- Litecoin has a bearish short-term bias, with the LTC / USD pair still undergoing a major downside breakout
- The four-hour time frame shows that bulls are testing back towards the neckline of a bearish head and shoulders pattern
- The daily time frame highlights a strong technical bounce from the LTC / USD pair’s 200-day moving average
Litecoin / USD Short-term price analysis
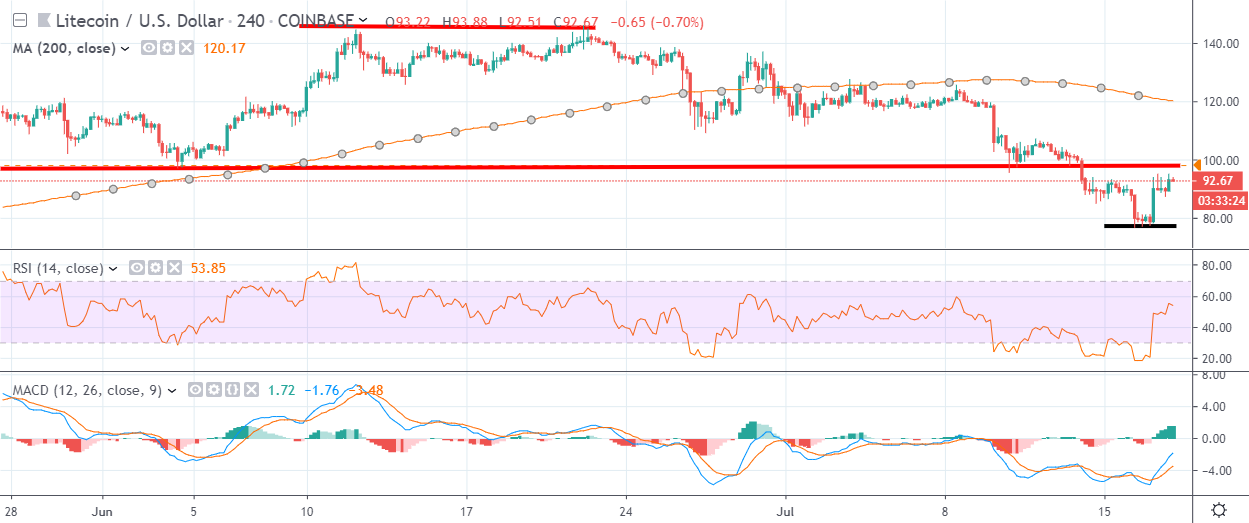
Litecoin has a bearish short-term bias, with the LTC / USD pair still in a bearish breakout mode over the lower time frames.
The four-hour time frame is showing that LTC / USD pair is now testing back towards the neckline of the bearish head and shoulders pattern, following a sharp reversal from just below the $80.00 level.
Key technical resistance above the neckline of the bearish pattern is located at the $107.00 and $120.00 levels.
Technical indicators on the four-hour time frame are attempting to correct from extreme oversold conditions.
Pattern Watch
Traders should note that the bearish head and shoulders pattern has yet to reach its overall downside target of $60.00.
Relative Strength Index
The Relative Strength Index on the four-hour time frame has turned bullish and is starting to issue a buy signal.
MACD Indicator
The MACD indicator is bullish on the four-hour time frame and continues to generate a buy signal.
Litecoin / USD Medium-term price analysis
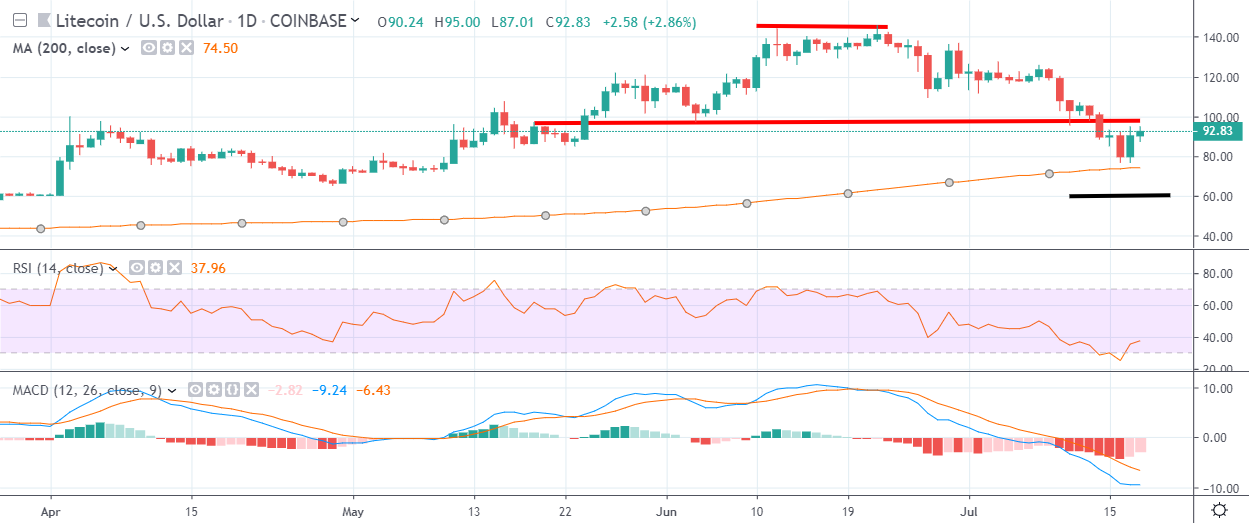
Litecoin has a bullish medium-term trading bias, with the cryptocurrency holding price above its trend defining 200-period moving average.
The daily time frame shows that a strong technical reversal from critical support has occurred, with the LTC / USD recovering back towards the initial bearish breakout zone.
Key technical support for the LTC / USD pair is currently found at the $74.00 and $60.00 levels.
Technical indicators on the daily time frame are attempting to move away from extreme oversold conditions.
Pattern Watch
Traders should note that the bearish head and shoulders pattern remains technically valid on the daily time frame.
Relative Strength Index
The Relative Strength Index on the daily time frame is bearish and is also attempting to move away from extreme oversold territory.
MACD Indicator
The MACD indicator is bearish on the daily time frame, although it is attempting to correct from oversold conditions.
Conclusion
Litecoin has staged a solid upside recovery, following the much-awaited bearish attack towards the LTC / USD pair’s key 200-day moving average.
The $100.00 to $80.00 price range is critical over the coming sessions and will ultimately decide whether the cryptocurrency continues to recover or falls back towards the $60.00 level.
Check out our coin guide for an introduction to Litecoin.
We also wrote a DARE for the project, analyzing the future prospects of the Bitcoin competitor.