 Earn with Nexo

Litecoin Price Analysis LTC / USD: Leaning On Support
Litecoin is consolidating over its supports, but pressure is heavy.
- Litecoin has a neutral short-term trading bias, with the cryptocurrency trading around its 200-period moving average on the four-hour time frame
- The four-hour time frame is showing that the LTC / USD pair has stopped creating higher highs
- The daily time frame continues to show that medium-term bulls are still in control
Litecoin / USD Short-term price analysis
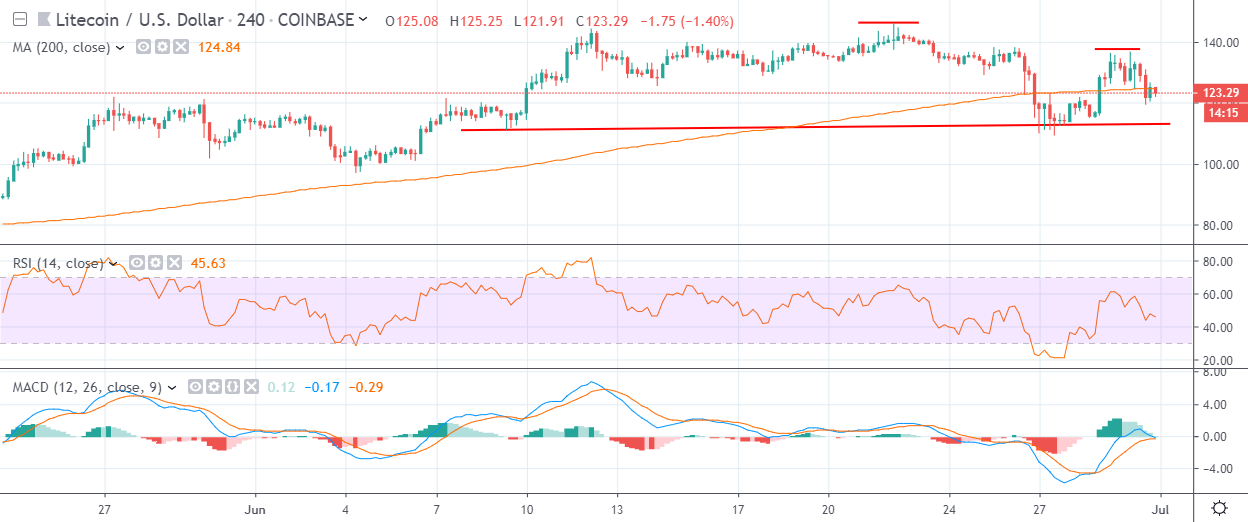
Litecoin has a neutral short-term trading outlook, with the LTC / USD pair consolidating around its 200-period moving average on the four-hour time frame.
The four-hour time frame is showing that the LTC / USD pair has stopped creating bullish higher highs, leaving the cryptocurrency vulnerable to further downside.
Technical indicators on the four-hour time frame are currently neutral and falling to provide a clear trading signal.
Pattern Watch
Traders should note that a bearish head and shoulders pattern has now formed on the four-hour time frame.
Relative Strength Index
The Relative Strength indicator on the four-hour time frame is also neutral and failing to provide a conclusive trading signal.
MACD Indicator
The MACD indicator on the four-hour time frame is neutral and failing to generate a clear trading signal.
Litecoin / USD Medium-term price analysis
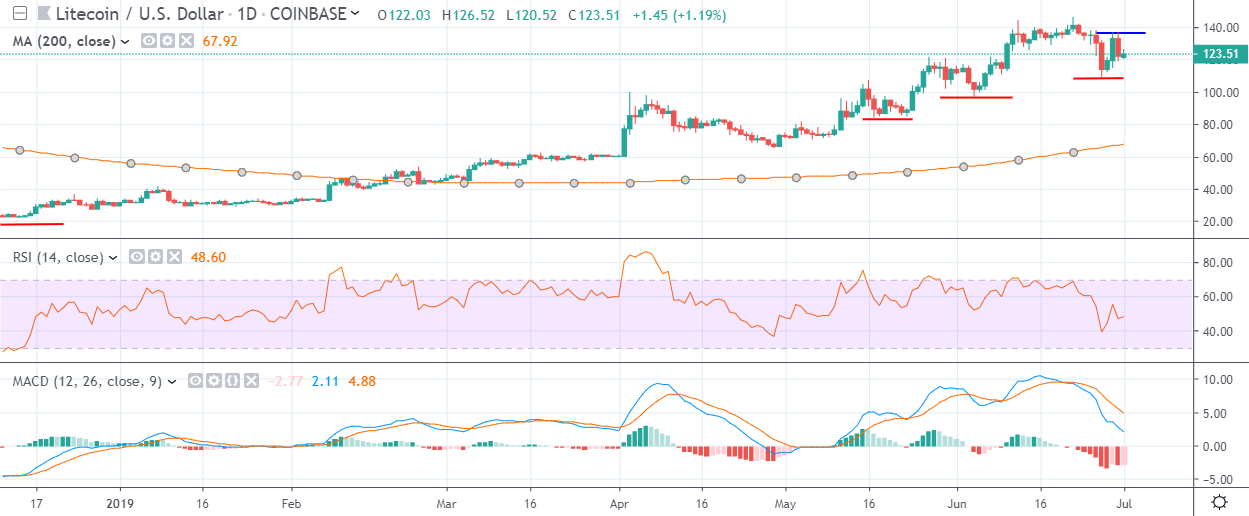
Litecoin still has a bullish medium-term trading bias, with the cryptocurrency holding price above key technical support on the daily time frame.
The daily time frame continues to show that medium-term bulls have the upperhand, with the LTC / USD pair still creating important higher highs and higher lows.
Key technical support for the LTC / USD pair is currently found at the $110.00 and $98.00 levels.
Technical indicators are moving lower and attempting to turn bearish on the daily time frame.
Pattern Watch
Traders should be on guard for a potential double-top pattern formation on the daily time frame.
Relative Strength Index
The Relative Strength indicator on the daily time frame is turning lower and is currently generating a bearish trading signal.
MACD Indicator
The MACD indicator is starting to turn bearish on the daily time frame, with both the MACD signal line and histogram turning lower.
Conclusion
Litecoin could start to come under selling pressure on the daily time frame if bulls fail to create a fresh price high over the coming trading sessions.
The bearish pattern on the four-hour time frame suggest that a sustained breach of the $110.00 level may trigger a short-term sell-off in the LTC / USD pair towards the $84.00 support level.
Check out our coin guide for an introduction to Litecoin.
We also wrote a DARE for the project, analyzing the future prospects of the Bitcoin competitor.