
LTC / USD Price Analysis: Bearish Retrace
The pair turned decisively bearish in the short term, but the daily time frame suggests this is just a correction.
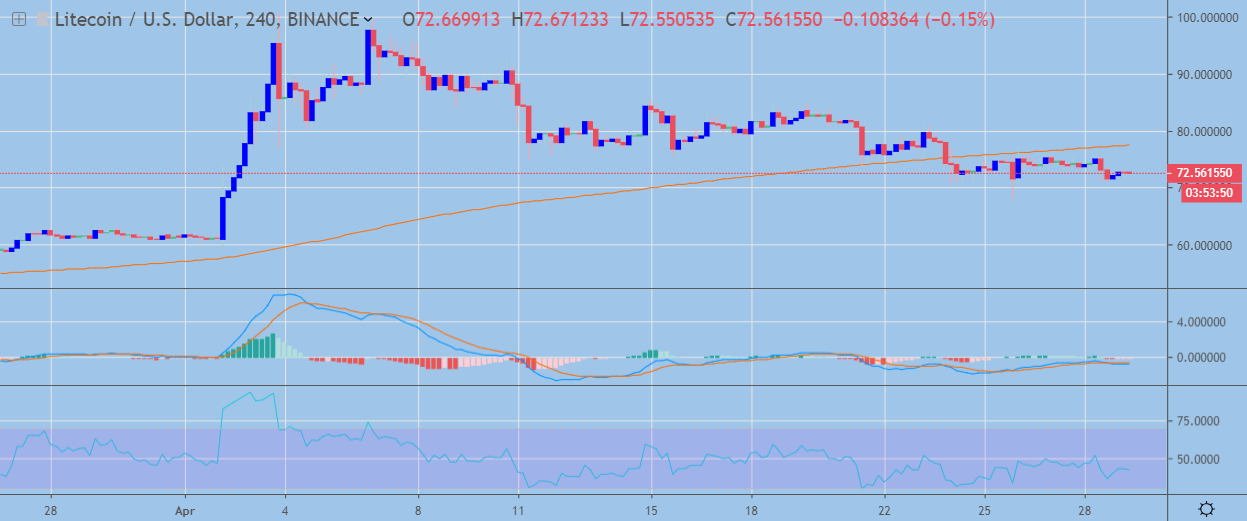
- LTC has a bearish short-term trading bias, with the cryptocurrency testing back towards its 200-period moving average
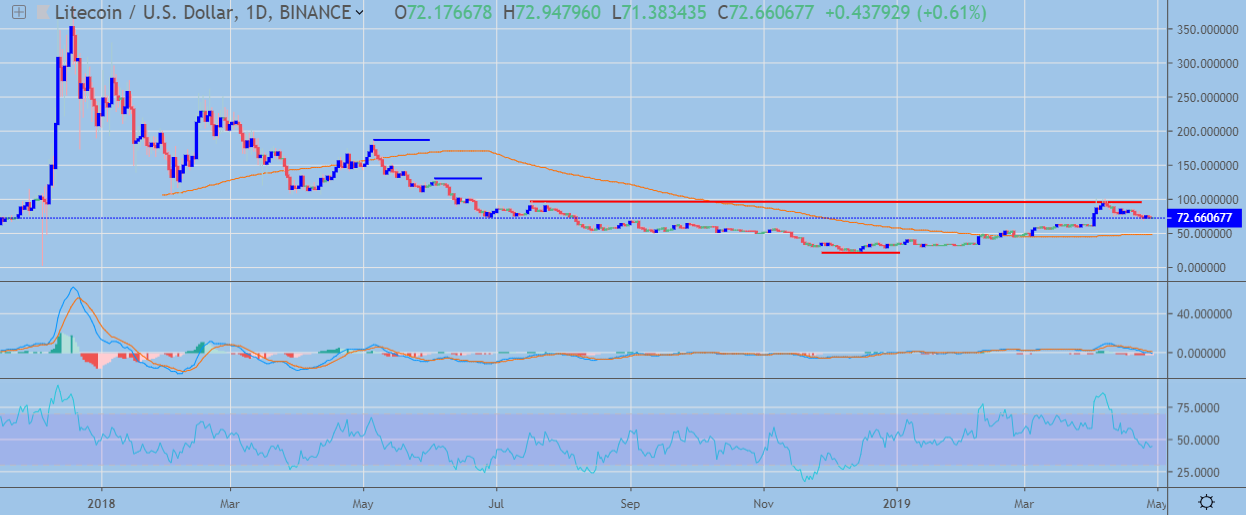
- The LTC / USD pair is still holding firm above its key 200-day moving average
- The bullish inverted head and shoulders pattern on the daily time frame remains valid
LTC / USD Short-term price analysis
LTC has a bearish short-term trading bias, with the LTC / USD pair now creating bearish lower lows and trading beneath its 200-period moving average on the four-hour time frame.
The bearish double-top pattern formation on the four-hour time frame continues to weigh on short-term trading sentiment with the LTC / USD pair so far finding interim support from the $68.00 level.
The four-hour time frame shows that key upcoming short-term support is located $60.00 and $54.00 levels.
 LTC / USD H4 Chart by TradingView
Pattern Watch
Traders should note that a large inverted head and shoulders pattern remains present across the four-hour time frame.
Relative Strength Index
The Relative Strength Index is bearish on the four-hour time frame, although it is now attempting to recover from oversold conditions.
MACD Indicator
The MACD indicator is neutral on the four-hour time frame, with the MACD signal line and histogram failing to generate a clear trading signal.
LTC / USD Medium-term price analysis
LTC still has a bullish medium-term trading outlook, with the cryptocurrency trading well above its trend defining 200-day moving average.
The daily time frame shows that the LTC / USD pair is retracing lower after the recent upside rally created a much larger inverted head and shoulders pattern.
Key technical support on the daily time frame is currently located at the start of the April bullish rally, around the $60.00 level, and the pair’s 200-day moving average, at $50.00.
 LTC / USD Daily Chart by TradingView
Pattern Watch
Traders should continue to monitor the neckline of the bullish inverted head and shoulders pattern on the daily time frame.
Relative Strength Index
The Relative Strength Index is bearish on the four-hour time frame, although it is now attempting to recover from oversold conditions.
MACD Indicator
The MACD indicator has turned bearish on the daily time frame, with the MACD signal line continuing to issue a sell signal.
Conclusion
LTC is still under pressure in the short-term, with the four-hour time frame highlighting that the near-term sentiment towards the LTC / USD pair is still bearish.
The daily time frame is still showing that the inverted head and shoulders pattern remains valid, while the $50.00 level is the key downside area to watch over medium-term.
For a quick look into Litecoin and LTC, check out our coin guide here.
If you need a deeper analysis, look into our Litecoin DARE.