 Earn with Nexo

LTC / USD Price Analysis: Leaning On Support
Litecoin is attempting to stage a recovery after finding solid support on the four-hour and daily timeframes.
- Litecoin has a bearish short-term trading bias, with the LTC / USD pair still trading below its 200-period moving average
- The LTC / USD pair has so far found strong technical support from the $65.00 level
- The daily time frame is showing multiple bullish patterns in play
LTC / USD Short-term price analysis
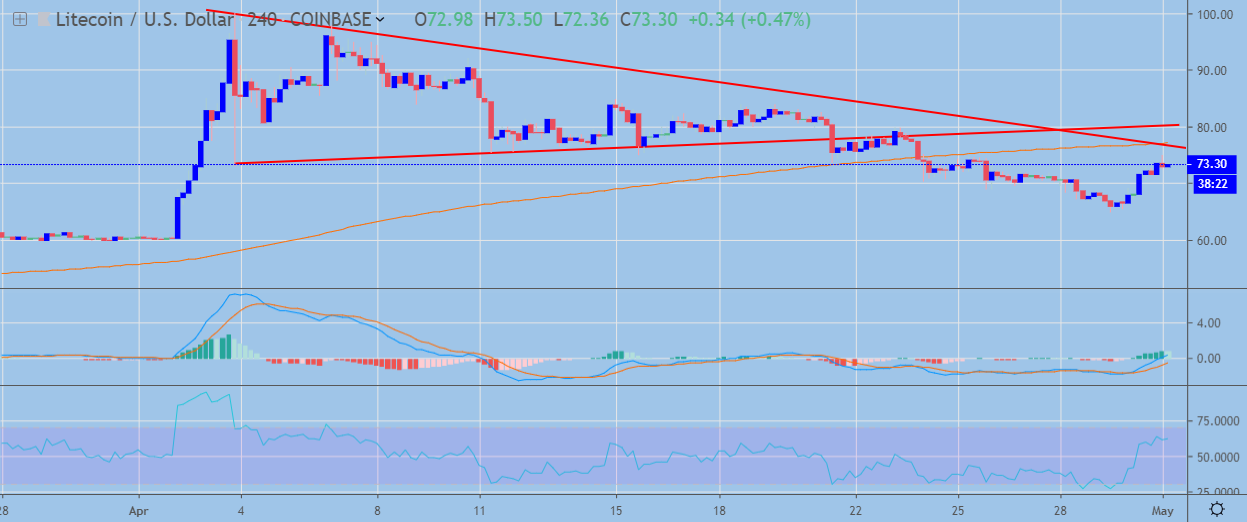
Litecoin retains its bearish short-term trading bias, with the LTC / USD pair still trading below its 200-period moving average on the four-hour time frame.
The four-hour time frame is showing that the LTC / USD pair is correcting back towards trendline resistance after finding strong technical support from the $65.00 level.
Technical indicators on the four-hour time frame are rising alongside the recent recovery in the LTC / USD pair.
 LTC / USD H4 Chart by TradingView
Pattern Watch
Traders should note that the bearish breakout from the symmetrical triangle pattern has yet to reach its full downside target.
Relative Strength Index
The Relative Strength Index is bullish on the four-hour time frame, although it is now approaching overbought conditions.
MACD Indicator
The MACD indicator is bullish on the four-hour time frame, with the MACD signal line generating a buy signal.
LTC / USD Medium-term price analysis
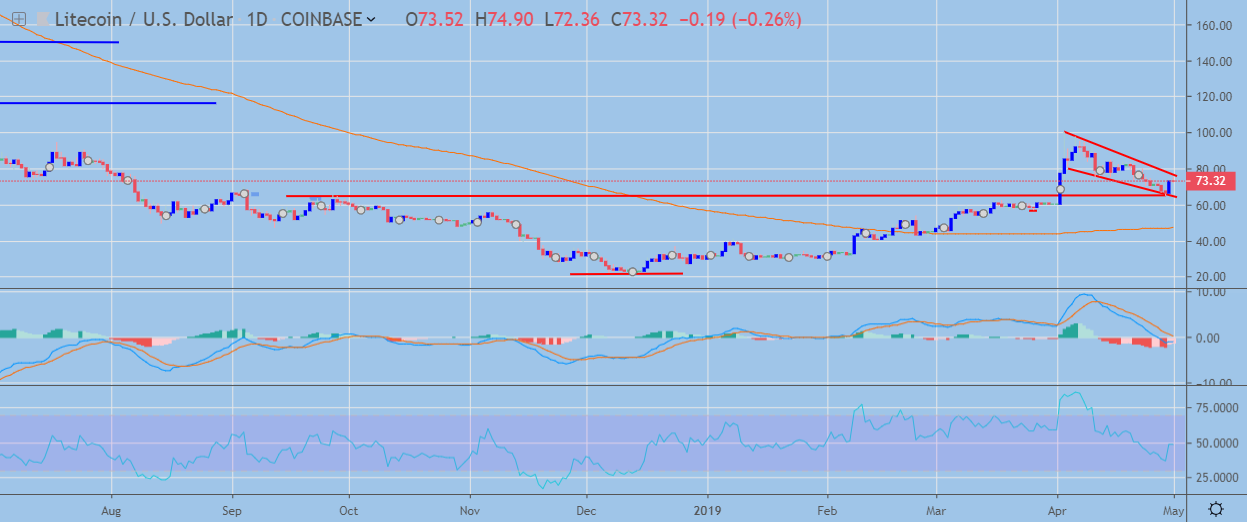
Litecoin retains its bullish medium-term trading outlook, with the cryptocurrency still holding price above major technical support on the daily time frame.
The daily time frame is also showing that multiple bullish patterns have emerged, with an inverted head and shoulders pattern and a falling wedge pattern now present.
Technical indicators are attempting to correct higher on the daily time frame, following the recent sharp drop from just below the $100.00 level.
 LTC / USD Daily Chart by TradingView
Pattern Watch
Traders should note that both bullish patterns highlight the $120.00 level as a potential upside target.
Relative Strength Index
The Relative Strength indicator is attempting to move higher on the daily time frame, although it has yet to turn bullish.
MACD Indicator
The MACD indicator is also attempting to turn bullish on the daily time frame.
Conclusion
Litecoin is attempting to regain its short-term bullish bias, with the popular cryptocurrency facing a key test of buying demand over the coming trading sessions.
The emergence of multiple bullish patterns on the daily timeframe suggests that the LTC / USD pair could start to trade above the $100.00 level over the medium-term.
For a quick look into Litecoin and LTC, check out our coin guide here.
If you need a deeper analysis, look into our Litecoin DARE.