 Earn with Nexo

Monero Price Analysis XMR / USD: Against The Ceiling
Monero has fallen deep, though some recovery attempts are being made.
- Monero has a bearish short-term trading bias, with the XMR / USD pair trading below its key 200-period moving average
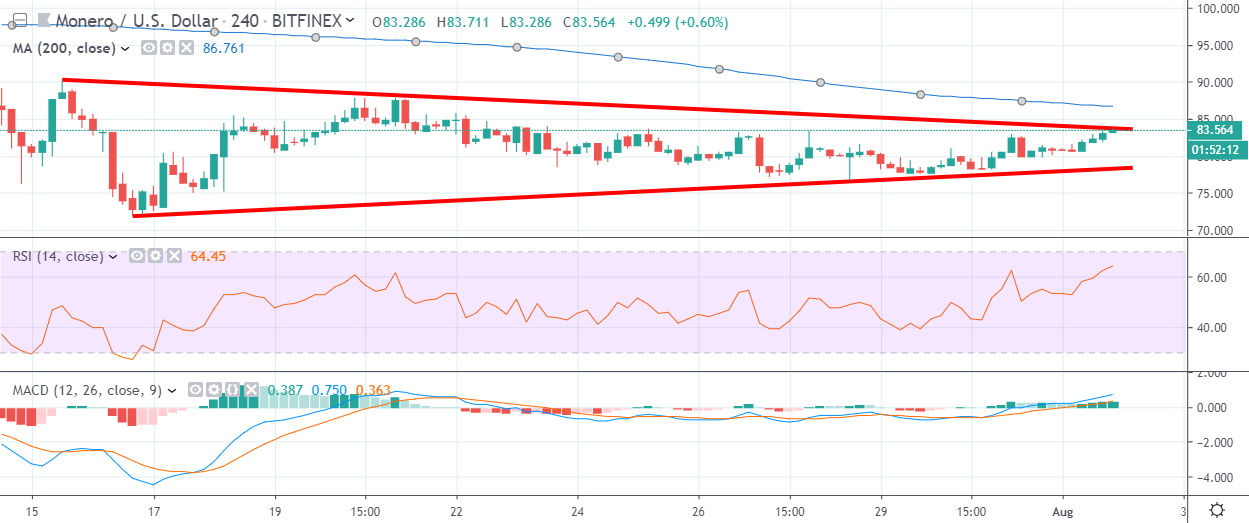
- The four-hour time shows that the XMR / USD pair is trapped within a triangle pattern
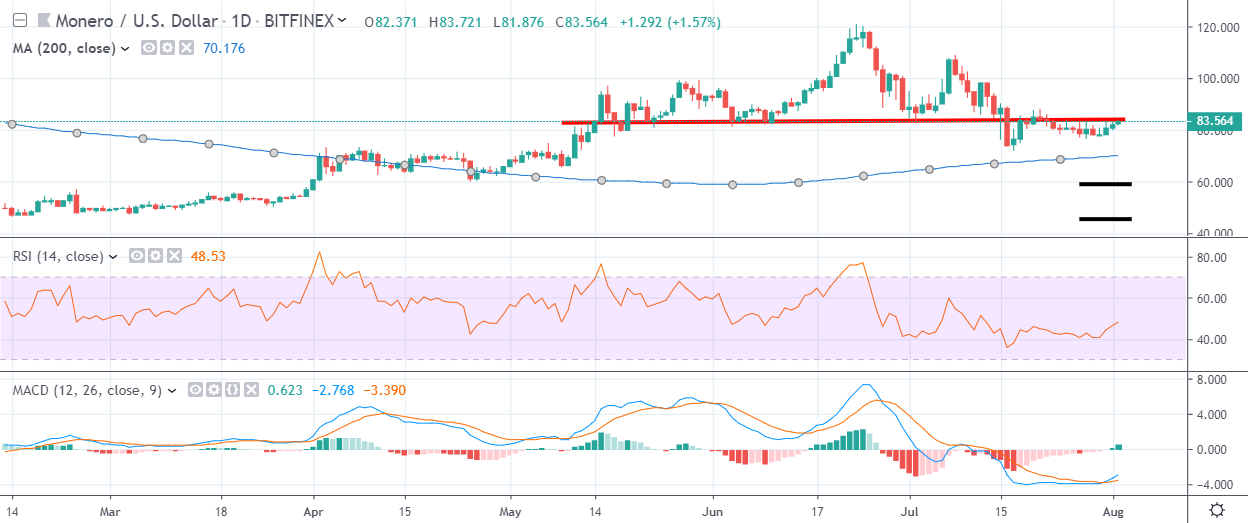
- The daily time frame shows that a bearish head and shoulders pattern is currently in play
Monero / USD Short-term price analysis
Monero has a bearish short-term outlook, with the cryptocurrency still trading well-below its key 200-period moving average on the four-hour time frame.
The four-hour time frame shows that the XMR / USD pair is trapped within a symmetrical triangle pattern, with bulls probing against key trendline resistance.
Technical indicators are bullish on the four-hour time frame and are issuing buy signals.
Pattern Watch
Traders should note that the breakout from the triangle pattern could provoke a $10.00 move in either direction.
Relative Strength Index
The RSI indicator is bullish on the four-hour time frame, although it is approaching overbought territory.
MACD Indicator
The MACD indicator has turned bullish on the four-hour time frame and continues to generate a buy signal.
Monero / USD Medium-term price analysis
Monero has a bullish medium-term outlook, with the cryptocurrency still holding price above its trend defining 200-day moving average.
The daily time frame is showing that bulls are probing towards the neckline of a large head and shoulders pattern that has yet to reach its full downside potential.
Technical indicators on the daily time frame are attempting to correct from oversold conditions.
Pattern Watch
Traders should note that the overall downside projection of the bearish pattern is located around the $50.00 level.
Relative Strength Index
The RSI indicator is attempting to correct from oversold conditions on the daily time frame, although it is still technically bearish.
MACD Indicator
The MACD Indicator on the daily time frame is bullish and continues to generate a buy signal.
Conclusion
Monero is at a critical junction technically and continues to push against major technical resistance across both the four-hour and daily time frames.
Further downside appears more likely, as the bearish pattern on the four-hour time frame still suggests that XMR / USD pair could eventually fall back towards the $45.00 level.
Check out the Monero coin guide for a quick look into the privacy coin.
For a deeper look we published a detailed DARE, part of our SIMETRI research offering.