 Earn with Nexo

Monero / USD Technical Analysis: Catching The Uptrend
The pair is slowly recovering to 2018 levels, though for the most part it's following the market.
- Monero is bullish in the short-term, with the XMR / USD pair advancing higher after a brief technical correction
- The four-hour time frame shows the formation of a bullish descending wedge pattern
- The daily time frame shows that the bullish inverted head and shoulders pattern has yet to reach its upside target
Monero / USD Short-term price analysis
Monero is bullish in the short-term, with the cryptocurrency testing back towards the best levels of the year following a brief technical correction lower.
On the four-hour time frame the XMR / USD pair is trading within a bullish descending wedge pattern, with the pattern holding an upside projection close to $10.00.
Technical indicators are bullish on the four-hour time frame and continue to signal further near-term gains for the XMR / USD pair.
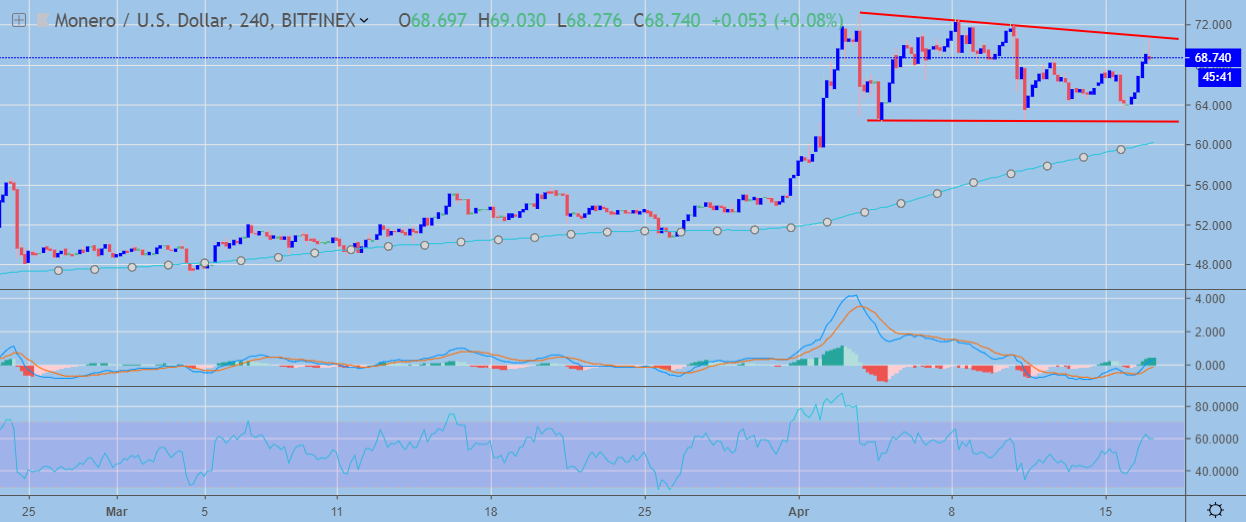 XMR / USD H4 Chart by TradingView
Pattern Watch
Traders should note that the November 19th, swing-high from last year offers the strongest form of technical resistance if the bullish inverted head and shoulders pattern is triggered.
Relative Strength Index
The RSI indicator is also bullish on the four-hour time frame and shows that pressure remains to the upside.
MACD Indicator
The MACD indicator is bullish on the four-hour time frame and is generating a strong buy signal.
Fundamental Analysis
Monero short-term price movements largely depend on the overall market. Although the coin was able to occupy the leading place in the privacy sector, its current price recovery was supported by the recovery of Bitcoin and other large players, while the project itself did not have any major announcements or updates in April.
Monero / USD Medium-term price analysis
Monero has a bullish medium-term outlook, with the cryptocurrency attempting to stabilize above its trend defining 200-day moving average.
The daily time frame is showing that the buyers have triggered a large inverted head and shoulders pattern, with the bullish pattern yet to reach its overall upside objective.
The daily time frame is also showing sizeable amounts of bullish MACD price divergence, which extends back towards May 2018.
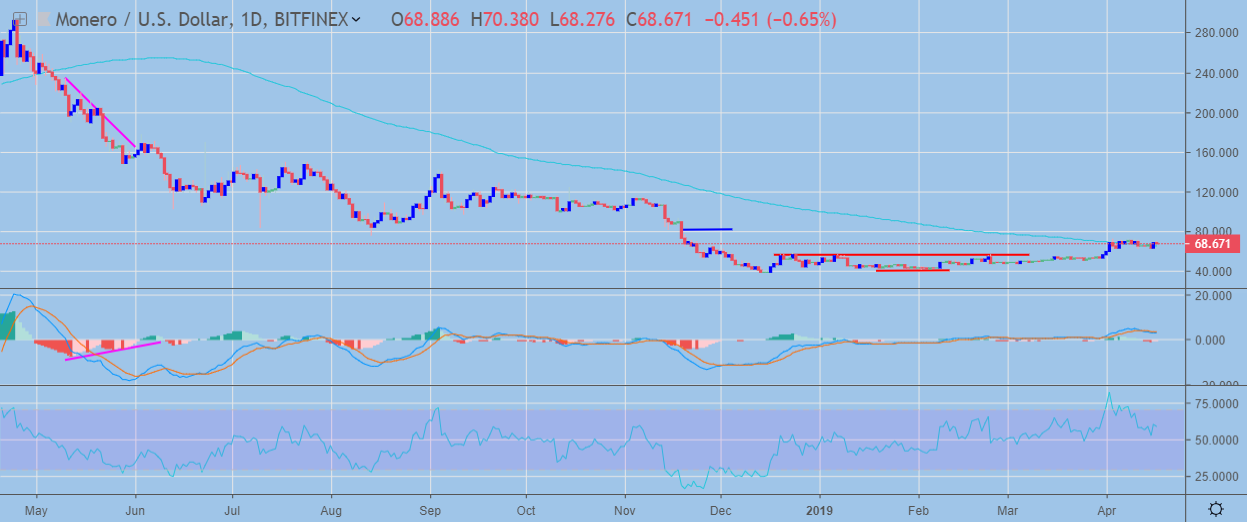 XMR / USD Daily Chart by TradingView
Pattern Watch
Traders should note that a bearish head and shoulders pattern could form on the daily time frame if buyers fail to hold onto recent trading gains.
Relative Strength Index
The RSI indicator is bullish on the daily time frame and is now attempting to move higher.
MACD Indicator
The MACD Indicator on the daily time frame is showing sizeable amounts of bullish MACD price divergence.
Fundamental Analysis
From the fundamental level, the coin will most likely continue to occupy the leading place in the privacy coins niche. Although for the past few months the competition in the sector has increased, Monero has already gained a large community which should help the coin to retain its positions, at least in the medium-term.
Conclusion
Monero is growing increasingly confident above its 200-day moving average, with the presence of bullish patterns on the four-hour and daily time frames highlighting that XMR / USD pair has scope to trade even higher.
The cryptocurrency has significant upside potential if medium-term bulls can sustain the XMR / USD pair at current levels and eventually reverse the bullish MACD divergence on the daily time frame.
Check out our coin guide for Monero for an introduction to the privacy coin.
To get a more nuanced look of the future perspectives of the project, we released a DARE report on the project.