 Earn with Nexo

Nano Price Analysis NANO / USD: Evolving From Bear To Bull
A new software release had a positive influence on Nano's price.
- Nano has a bearish short-term trading outlook, with the NANO / USD pair struggling to recover back above key technical resistance
- The four-hour time frame shows a bearish head and shoulders pattern that has yet to reach its full downside target
- The daily time frame shows an extremely large bullish falling wedge pattern
Fundamental Analysis
Nano has been getting some respite from the downtrend after the project released the latest version of its node software Solidus, last week. The update brings a broad range of improvements to the network. It provides added security, efficiency and makes it easier for services to integrate Nano. All these factors should have a positive effect on the adoption of the Nano’s network.
Nano / USD Short-term price analysis
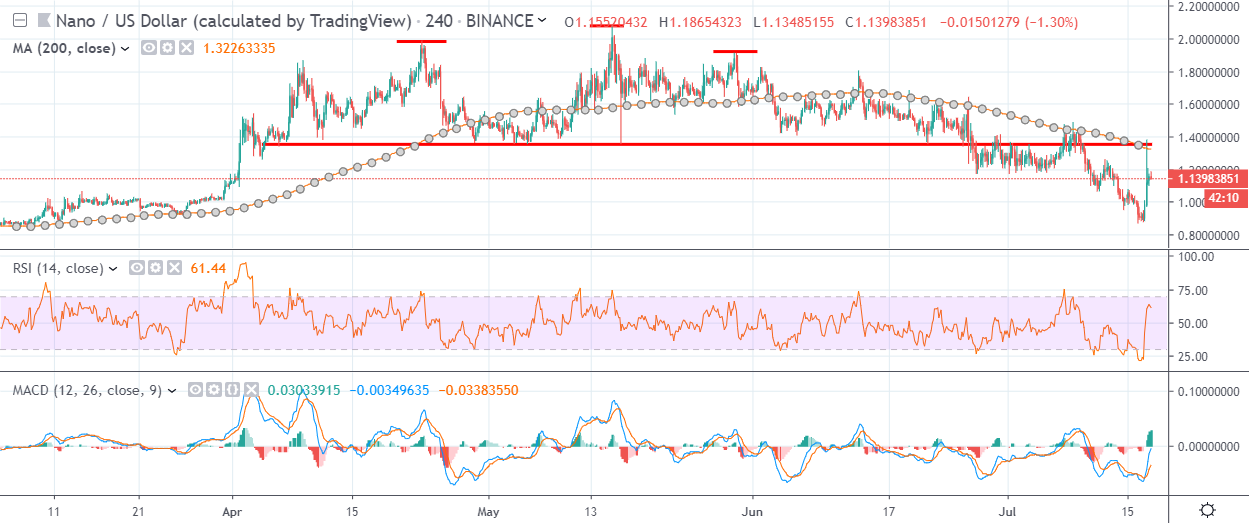
Nano has a bearish short-term trading bias, with the cryptocurrency struggling to move back above key resistance on the four-hour time frame.
The four-hour time frame shows that the NANO / USD pair has suffered a strong technical rejection after bulls tested back towards the neckline of a large head and shoulders pattern.
Technical indicators on the four-hour time frame have turned bullish and are continuing to generate a buy signal.
Pattern Watch
Traders should note that the head and shoulders pattern across the four-hour time frame has yet to reach its overall bearish downside target.
Relative Strength Index
The Relative Strength Index is bullish on four-hour time frame and still shows scope for further upside.
MACD Indicator
The MACD indicator on the four-hour time frame remains bullish and is generating a buy signal.
Nano / USD Medium-term price analysis
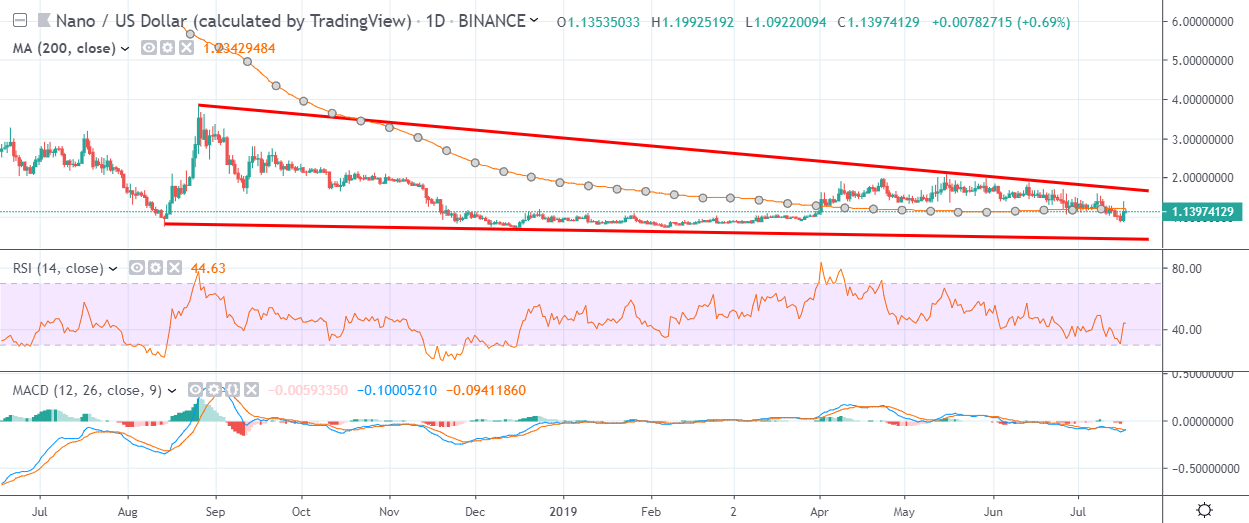
Nano has a neutral medium-term outlook, with the NANO / USD pair still consolidating around its trend defining 200-day moving.
The daily time frame is showing that the cryptocurrency is trapped within a large falling wedge pattern, with NANO / USD bulls repeatedly failing to break above the top of the bullish pattern.
Technical indicators on the daily time frame are bearish and continue to issue sell signals.
Pattern Watch
Traders should note that the line of least resistance is currently to the downside, following multiple technical rejections from the top of the falling wedge pattern.
Relative Strength Index
The RSI indicator on the daily time frame is also bearish, although it is now attempting to correct from oversold conditions.
MACD Indicator
The MACD indicator on the daily time frame remains bearish and is still generating a sell signal.
Conclusion
Nano bulls will need to move price above the neckline of the head and shoulders pattern in the near-term or the cryptocurrency is at risk of further substantial losses.
Sustained weakness below the NANO / USD pair’s key 200-day moving average may result in a technical test of the falling wedge patterns lower trendline.
Check out our Nano coin guide for a quick introduction to the project.