 Earn with Nexo

NEO Price Analysis NEO / USD: Looking Up
NEO likely found its technical bottom, but the recovery could take time.
- NEO has a bearish short-term outlook, with the cryptocurrency trading below its 200-period moving average on the four-hour time frame
- The bearish head and shoulders pattern on the four-hour time frame has now reached its full downside projection
- The daily time frame continues to show a valid inverted head and shoulders pattern
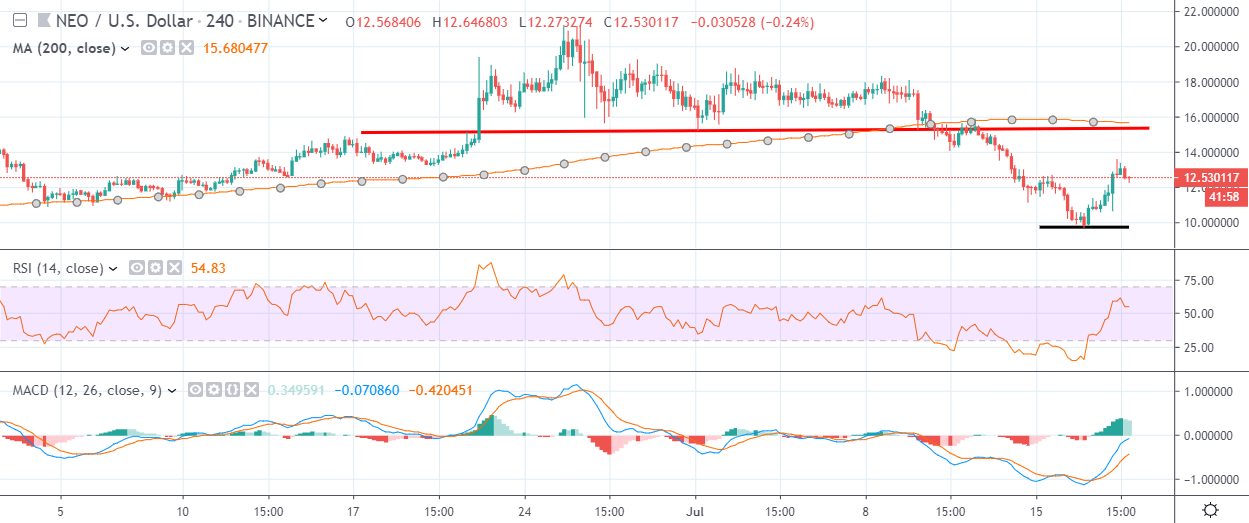
NEO / USD Short-term price analysis
NEO has a bearish short-term trading outlook, with the cryptocurrency trading well below its 200-period moving average on the four-hour time frame.
The four-hour time frame is showing that the NEO / USD pair has rebounded sharply higher after the bearish head and shoulders pattern reached its overall downside projection.
Technical indicators on the four-hour time frame are bullish and continue to issue a strong buy signal.
Pattern Watch
Traders should note that a bullish reversal pattern could start to form now that the inverted head and shoulders pattern has reached its downside projection.
Relative Strength Index
The RSI indicator has turned bullish on the four-hour time frame and is also issuing a buy signal.
MACD Indicator
The MACD indicator has turned bullish on the four-hour time frame and is starting to generate a buy signal.
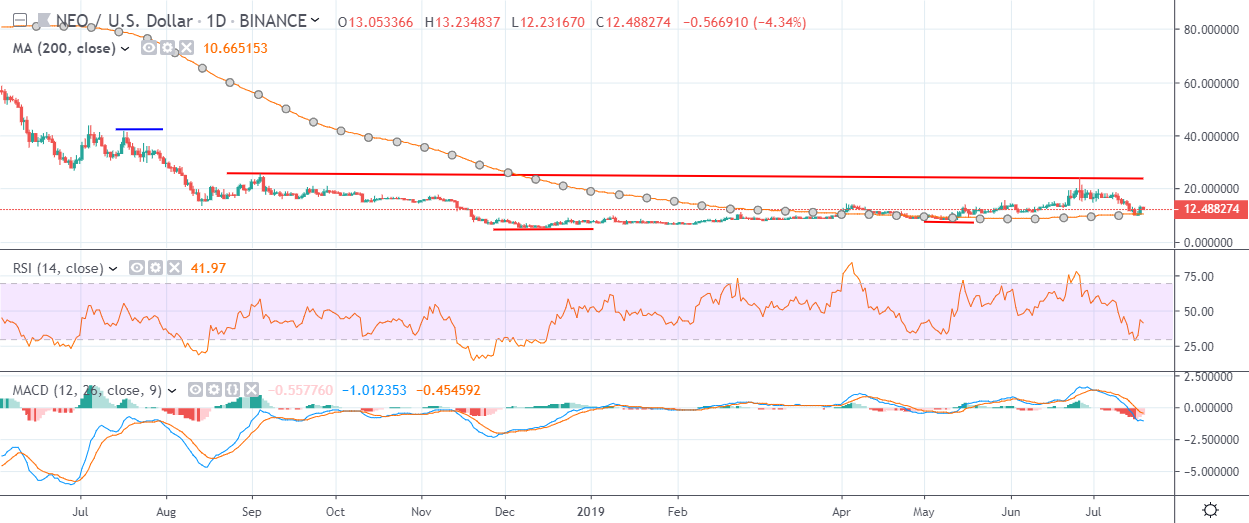
NEO / USD Medium-term price analysis
NEO has a bullish medium-term outlook, with the cryptocurrency holding firm above its trend defining 200-period moving average.
The daily time frame is showing that the recent decline in the NEO / USD pair has failed to invalidate the large inverted head and shoulders pattern.
Technical indicators on the daily time frame are still bearish, despite the recent correction higher in the NEO / USD pair.
Pattern Watch
Traders should note that the July 17th swing-high is the overall target of the inverted head and shoulders pattern on the daily time frame.
Relative Strength Index
The RSI indicator is attempting to recover higher on the daily time frame, although it remains technically bearish.
MACD Indicator
The MACD indicator on the daily time frame is still bearish and continues to issue a sell signal.
Conclusion
NEO is attempting to recover upside momentum after potentially forming a very important technical bottom across both time horizons.
The formation of a bullish reversal pattern on the lower time frames may indicate that the NEO / USD pair is ready to test back towards the neckline of the inverted head and shoulders pattern on the daily time frame.
For a quick look into NEO, check out our coin guide.