RavenCoin Price Analysis RVN / USD: Phoenix Rising
Ravencoin is flying high again.

Share this article
- RavenCoin has a bullish short-term bias with the cryptocurrency still trading above key technical support on the four-hour time frame
- The four-hour time frame continues to show a large bullish pattern
- The daily time frame is currently showing multiple bullish patterns
Fundamental Analysis
RavenCoin has surged after the project has announced listing on the Crypto.com. Users will be able to purchase RVN using bank transfers and credit cards, which should increase the adoption and liquidity of the coin.
RavenCoin / USD Short-term price analysis
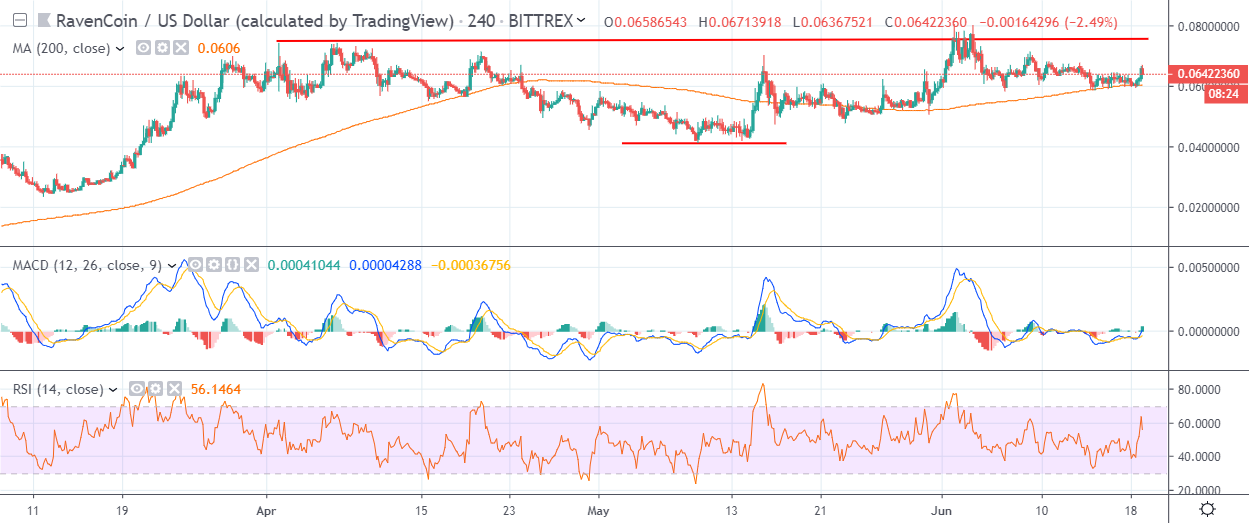
RavenCoin has a bullish short-term outlook, with the cryptocurrency still trading above major technical support on the four-hour time frame.
The four-hour time frame shows that a complex inverted head and shoulders pattern has formed, with the RVN / USD pair attempting to move back towards neckline resistance.
Technical indicators on the four-hour time frame have turned bullish and continue to issue a buy signal.

Pattern Watch
Traders should note that the RVN / USD pair will move to a new all-time price high if the bullish pattern is fully ignited on the four-hour time frame.
Relative Strength Index
The RSI indicator is still bullish on the four-hour time frame and shows scope for further upside.
MACD Indicator
The MACD indicator is bullish on the four-hour time frame and continues to generate a buy signal.
RavenCoin / USD Medium-term price analysis
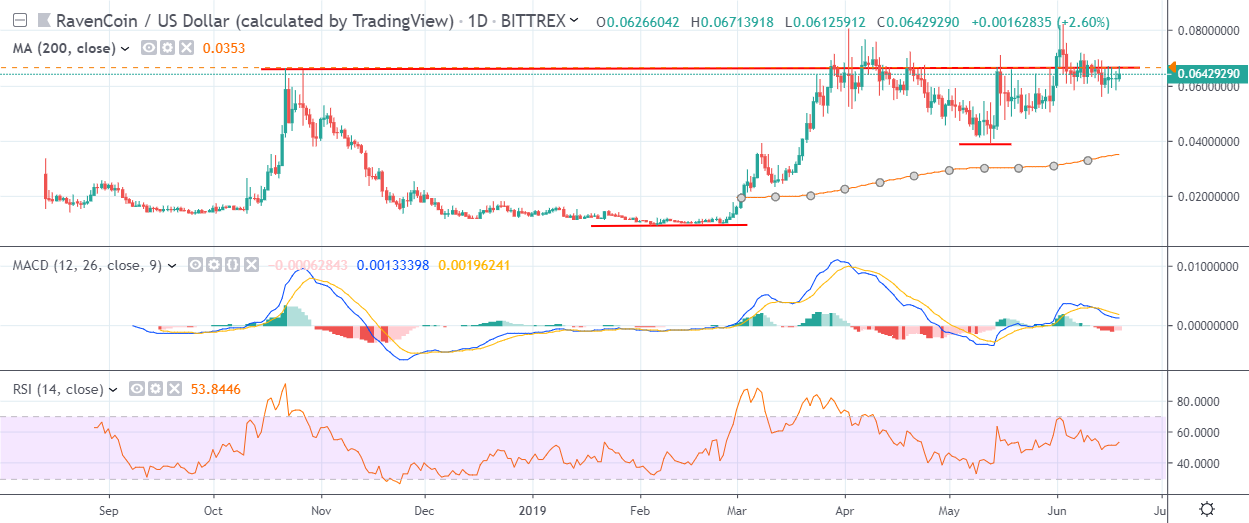
RavenCoin has a bullish medium-term outlook, with the RVN / USD pair testing major technical resistance on the daily time frame.
The daily time frame is showing that multiple bullish inverted head and shoulders patterns have formed, with RVN / USD bulls once again attempting to move price above breakout resistance.
Technical indicators on the daily frame are mixed and are failing to generate a clear trading signal.

Pattern Watch
Traders should note that RaveCoin could nearly double in value if bulls can fully ignite the large bullish pattern on the daily time frame.
Relative Strength Index
The RSI indicator is trading close to neutral levels and is currently flatlined on the daily time frame.
MACD Indicator
The MACD indicator is conflicted on the daily time frame and is failing to generate a clear trading signal.
Conclusion
RavenCoin shows tremendous short and medium-term upside potential, with the bullish patterns on both time frames underscoring that the cryptocurrency could eventually rally way beyond its current all-time record price high.
Check out our RavenCoin guide for insights.
