 Earn with Nexo

Tezos Price Analysis: Continuous Growth
Tezos is bucking the trend of crypto.
- Tezos has a bullish short-term and medium-term trading outlook
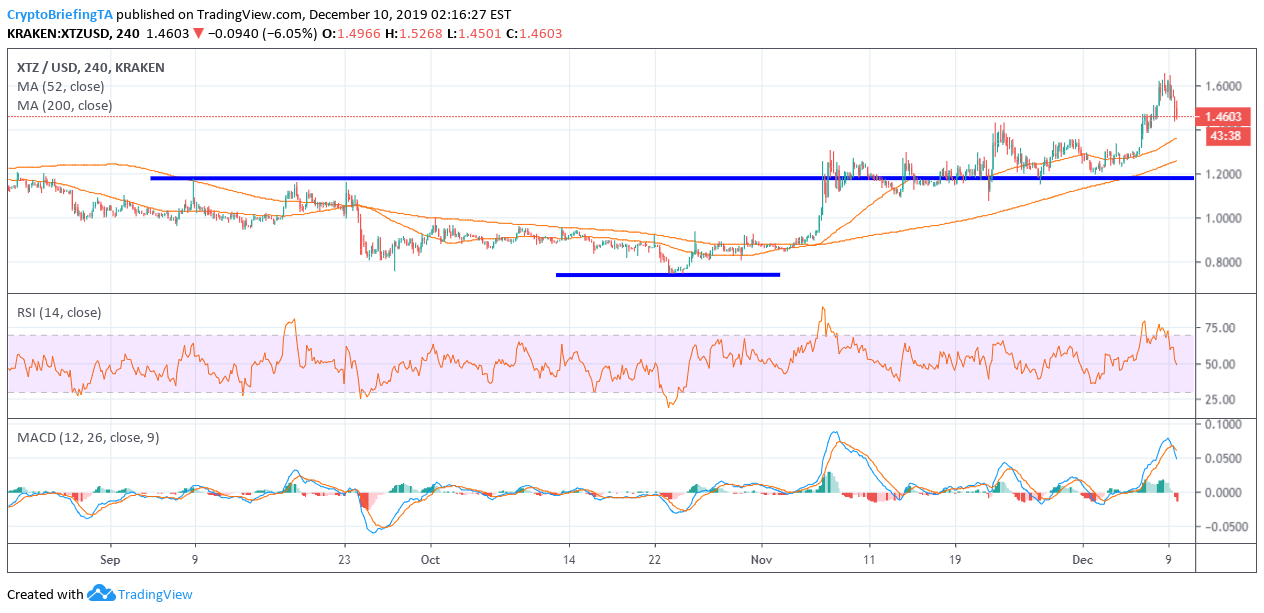
- The four-hour time frame shows that a bearish reversal may start to take place
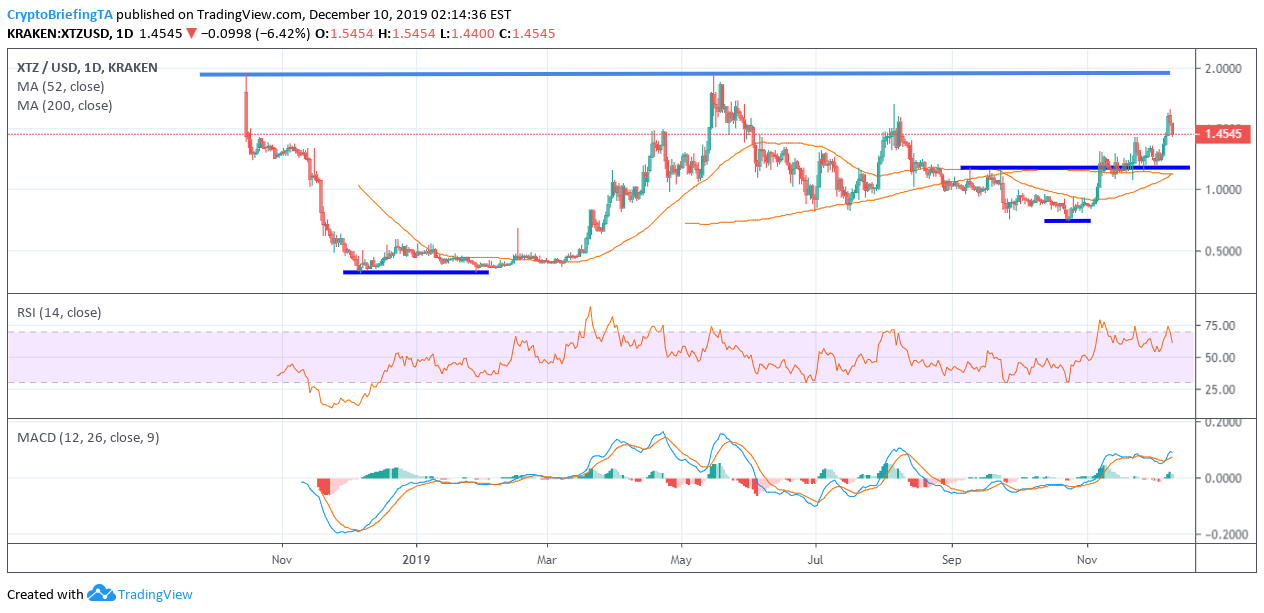
- The daily time frame continues to show the presence of a large bullish pattern
Tezos is starting to correct lower after the cryptocurrency recently rallied to its highest trading level since August this year. Technical analysis suggests more downside may occur before the XTZ/USD pair starts to push higher again.
Technical analysis on the lower time frames shows that the cryptocurrency is starting an overdue technical pullback, after the bullish inverted head and shoulders pattern on the lower time frames reached its full upside potential.
The cryptocurrency is still a strong buy on dips over the medium-term, as it has a bullish medium-term trading outlook. Furthermore, XTZ is one of the few large cryptocurrencies that has consistently traded above its 200-day moving average, despite the decline of the broader market.
The lower time frame suggests that the $1.20 level may be the bearish correction target and potential area where bulls will look to buy the XTZ/USD pair.
The daily time frame is still extremely bullish and shows that the cryptocurrency could surge in value once the price crosses above the $2.00 level. A break above $1.70 should secure a test of the $2.00 level.
Looking at the overall upside objective for the XTZ/USD pair over the medium-to-long term, the inverted head and shoulders pattern on the daily and weekly time frames both point to the $3.70 area as a potential target.
The Relative Strength Index on the weekly time frame is bullish and holding well-above 60, while the MACD indicator is extremely bullish.
Upside Potential
The four-hour time frame shows that key technical resistance is now located at the $1.65 and $1.70 levels.
Key technical resistance over the medium-term is located at the $2.00 and $2.30 levels.
Downside Potential
The four-hour time frame is showing that the XTZ/USD pair has strong medium-term technical support around the $1.40 and $1.20 levels.
Critical long-term technical support for Tezos is located at the $1.00 support level.
Summary
Tezos is one of the few top 20 cryptocurrencies remaining consistently bullish despite the broader market decline, though signs of short-term exhaustion should be taken into consideration.
Both the four-hour and daily time frames are showing that a breakout above the $2.00 level could cause the XTZ/USD pair to surge in value even more.