Shutterstock cover by Andrei Orlov
Tezos Price Could Double if it Breaks Crucial Resistance
Tezos appears ready to enter a new bull trend towards new all-time highs.
Market participants are showing fear after this week’s crypto flash crash. Still, some assets like Tezos are showing that the bull market might not be over as they prepare for new all-time highs.
Tezos Could Enter New Uptrend
Tezos could be ready to rally.
The blockchain’s XTZ has staged a significant recovery following the crypto market’s flash crash on Sep. 7. Its price has rebounded by nearly 80%, rising from a low of $3.90 to a high of $6.90.
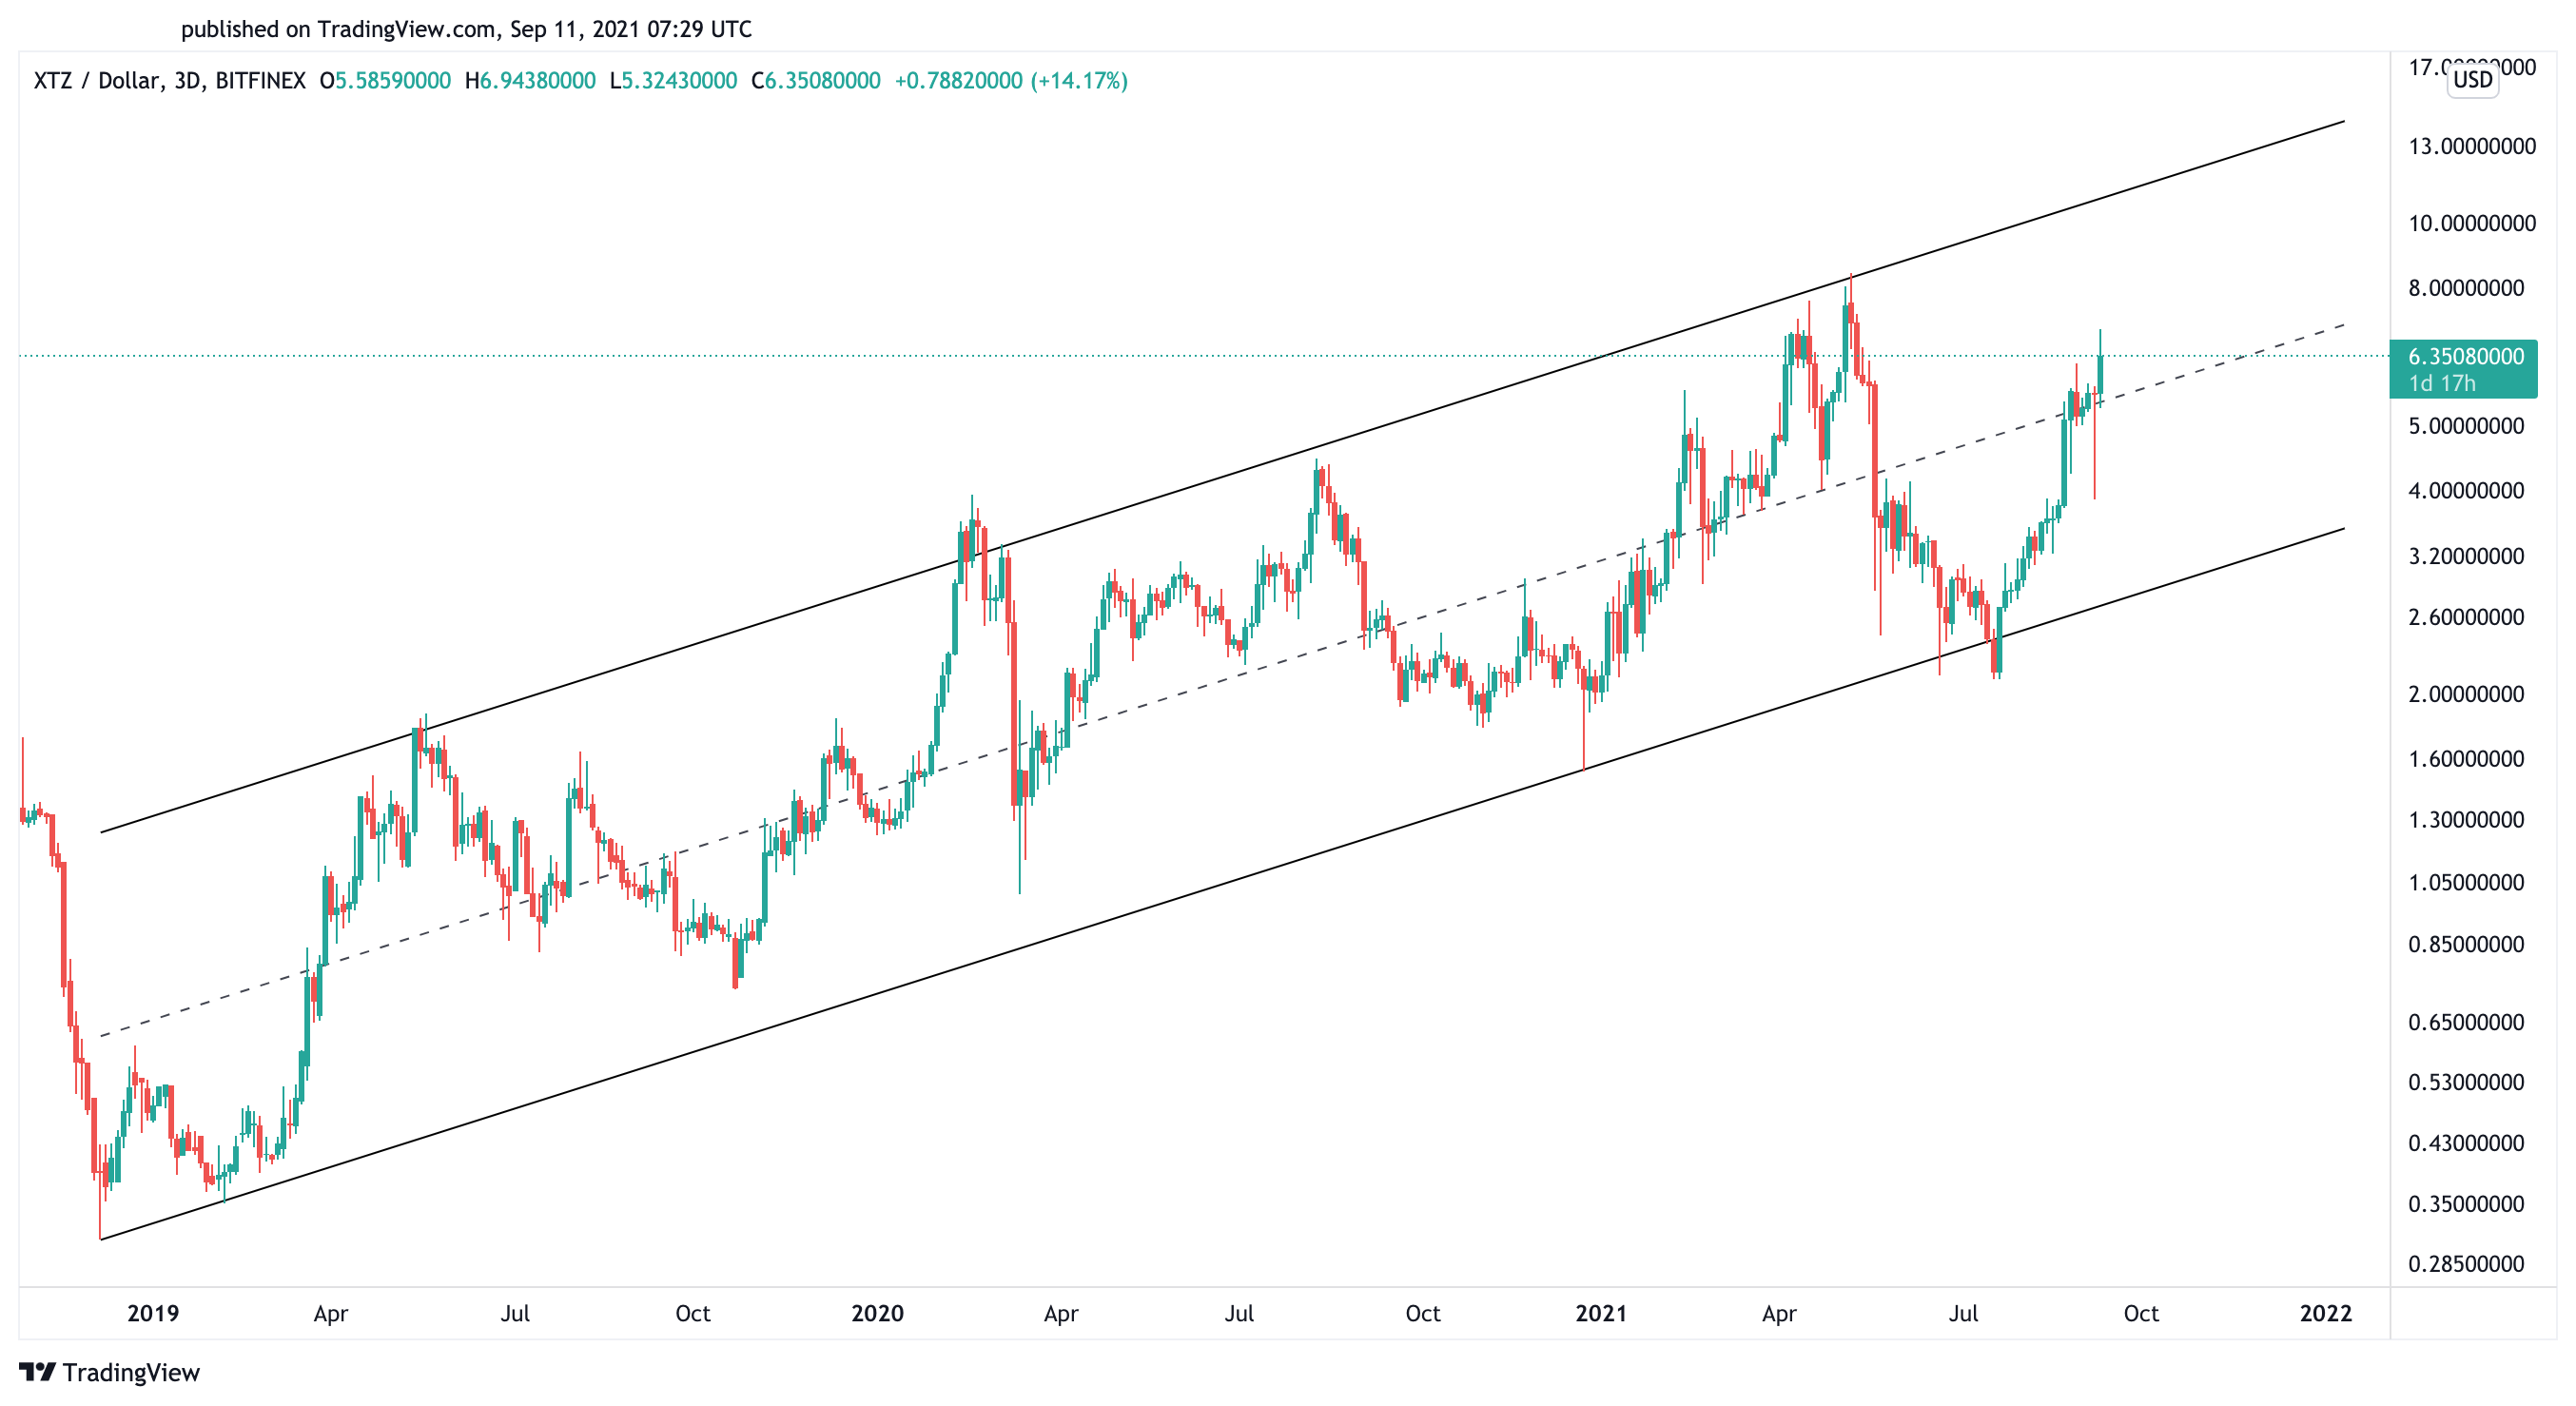
It appears that the recent bullish impulse has allowed XTZ to slice through the middle trendline of a parallel channel where its price has been contained since 2019.
Every time Tezos has risen to the channel’s upper or middle boundary since then, a rejection has occurred, pushing prices to the lower edge. From this point, it tends to rebound, which is consistent with the characteristic of a channel.
The consolidation pattern on the three-day chart suggests that as long as the channel’s middle trendline at $5.40 holds, XTZ could advance towards the upper boundary at $12. But losing this crucial level as support could lead to a steep correction to the channel’s lower edge at $3.

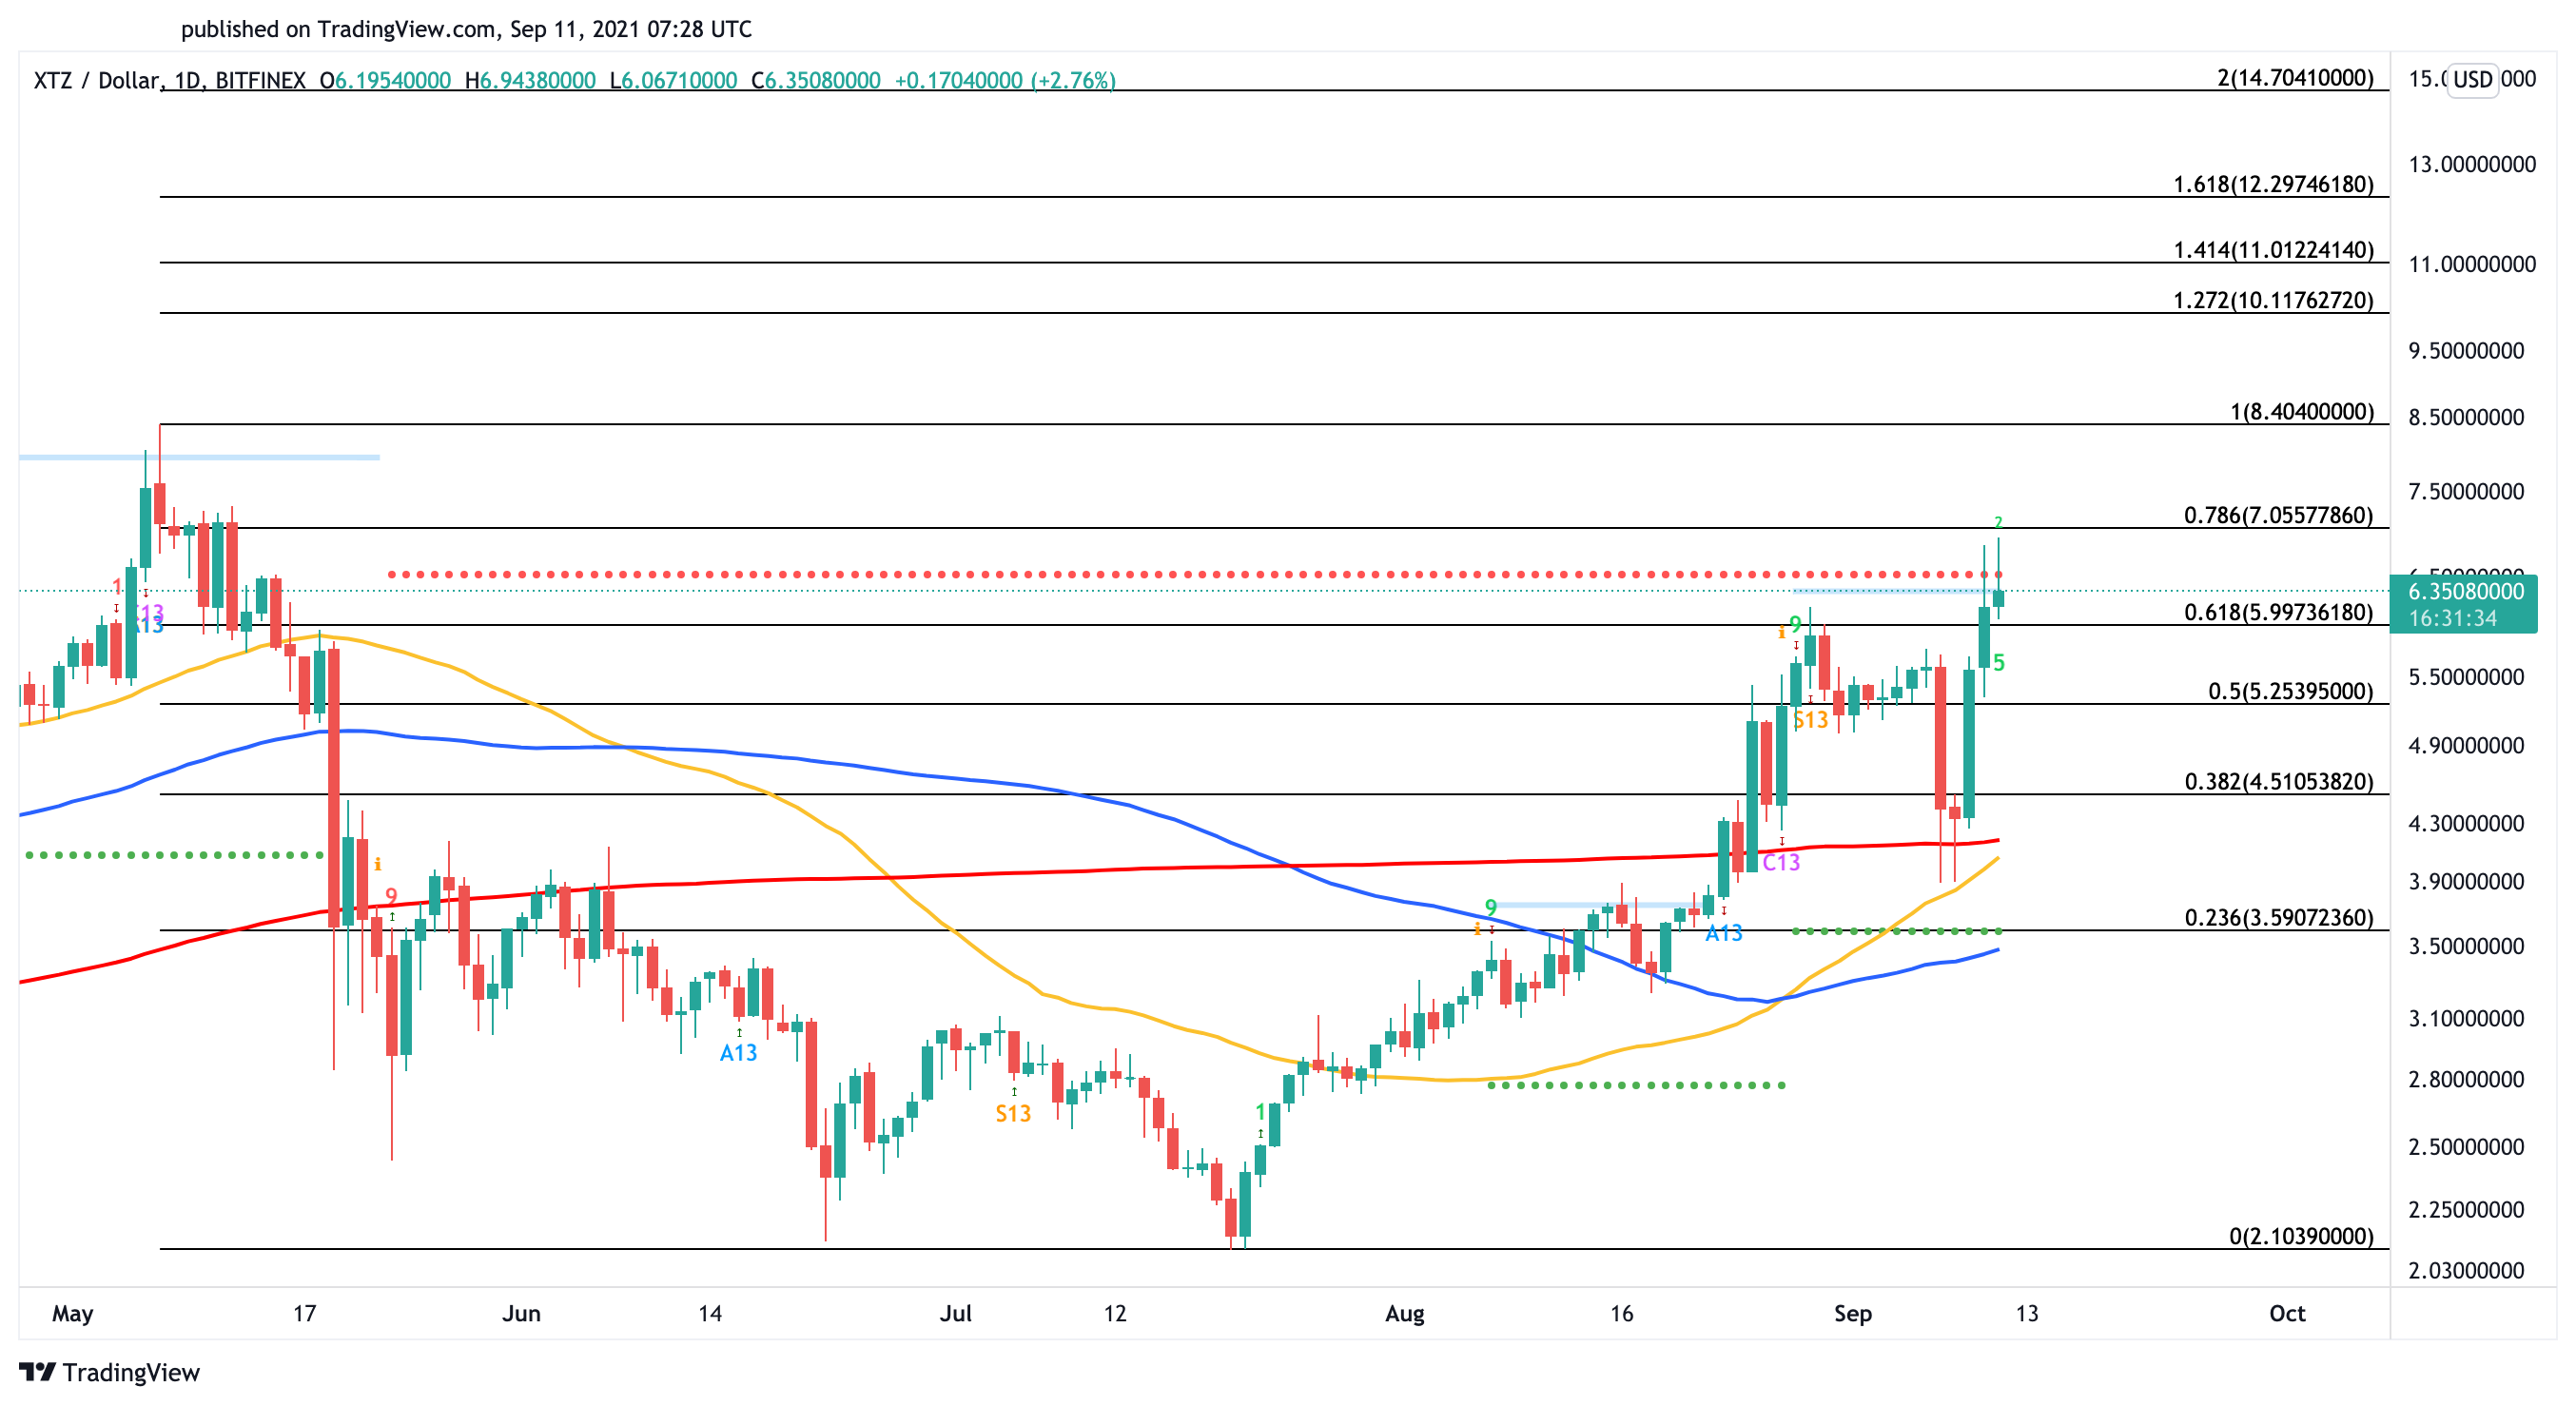
From a lower time frame such as the daily chart, Tezos’ outlook becomes more clear. The Tom DeMark (TD) Sequential indicator shows that the resistance setup trendline at $6.60 is acting as stiff resistance, preventing XTZ from advancing further.
Therefore, only a decisive daily candlestick close above this resistance level is likely to mark the beginning of an 83% run towards $12.

It is worth noting that in the event of a sell off there is an important support cluster that could prevent Tezos from slicing through the channel’s lower boundary.
The price range between $4 and $3 is fortified by the 200, 100, and 50-day moving averages as well as the TD’s support setup trendline and the 23.6% Fibonacci retracement level. This important demand wall could keep falling prices at bay, serving as a rebound zone.
