
Lower gasoline prices restrain US retail sales, but the underlying momentum tells a better story

Lower gasoline prices restrain US retail sales, but the underlying momentum tells a better story

June retail data shows a 0.2% headline gain that undersells the consumer resilience hiding beneath falling gas prices

Numbers can lie by telling the truth. US retail sales rose just 0.2% in June 2026, which sounds underwhelming until you notice that a collapse in gasoline prices was doing most of the damage to the headline figure. Strip that out, and the American consumer looks considerably more alive than the topline suggests.

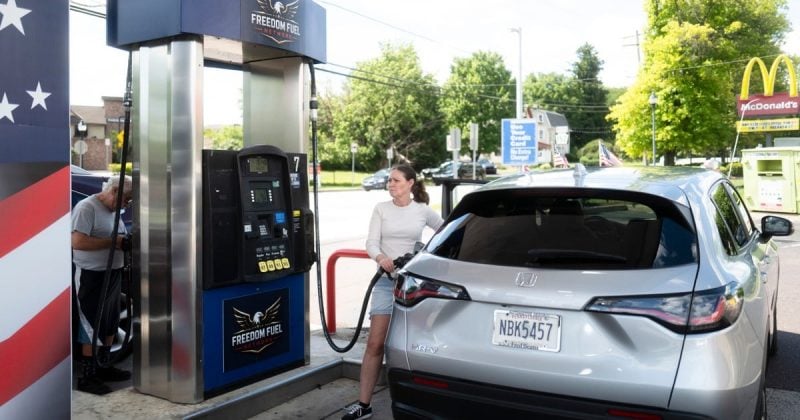
Total retail sales reached $768.6 billion in June, matching what economists had penciled in. The modest headline gain, though, was dragged down almost entirely by a 5.3% monthly drop in gasoline station receipts, the direct result of average pump prices falling from $4.61 per gallon in May to $4.18 in June, per data from the US Energy Information Administration.

What the headline number is hiding

Retail sales excluding gasoline rose 0.7% month-over-month in June. That is a materially different story than 0.2%.

Advertisement

The number economists watch most closely for GDP implications is the so-called control group, which strips out automobiles, gasoline, building materials, and food services to get at the core of discretionary consumer spending. That figure posted a 0.5% gain in June, a reading that feeds directly into the personal consumption component of GDP calculations.

Year-over-year, the picture is even clearer. Total retail sales grew 6.7% compared to June of the prior year, with the second quarter as a whole running 6.4% ahead of the same period last year.

Motor vehicles and online retail were called out as particular bright spots, two categories that tend to reflect genuine discretionary confidence rather than inflation-driven price increases.

The labor market is backing up the spending data

Weekly jobless claims fell to 208,000, the lowest reading since May 2026. Jobless claims are one of the more real-time economic indicators available, reported weekly with a short lag. A reading at 208,000 sits comfortably in what most economists would consider healthy territory, suggesting that layoffs remain contained even as interest rates have stayed elevated for an extended period.

What this means for investors navigating consumer exposure

The 6.7% year-over-year growth figure reflects durable demand, the kind that tends to support revenues for retailers, discretionary brands, and the payment networks that sit underneath all of it.

The control group’s 0.5% gain is the figure that will get the most attention from GDP trackers. A strong control group reading in the final month of a quarter tends to lift nowcast estimates for personal consumption expenditure, which is the single largest component of US GDP.

Disclosure: This article was edited by Editorial Team. For more information on how we create and review content, see our Editorial Policy.

Lower gasoline prices restrain US retail sales, but the underlying momentum tells a better story

Lower gasoline prices restrain US retail sales, but the underlying momentum tells a better story

June retail data shows a 0.2% headline gain that undersells the consumer resilience hiding beneath falling gas prices

Numbers can lie by telling the truth. US retail sales rose just 0.2% in June 2026, which sounds underwhelming until you notice that a collapse in gasoline prices was doing most of the damage to the headline figure. Strip that out, and the American consumer looks considerably more alive than the topline suggests.

Total retail sales reached $768.6 billion in June, matching what economists had penciled in. The modest headline gain, though, was dragged down almost entirely by a 5.3% monthly drop in gasoline station receipts, the direct result of average pump prices falling from $4.61 per gallon in May to $4.18 in June, per data from the US Energy Information Administration.

What the headline number is hiding

Retail sales excluding gasoline rose 0.7% month-over-month in June. That is a materially different story than 0.2%.

Advertisement

The number economists watch most closely for GDP implications is the so-called control group, which strips out automobiles, gasoline, building materials, and food services to get at the core of discretionary consumer spending. That figure posted a 0.5% gain in June, a reading that feeds directly into the personal consumption component of GDP calculations.

Year-over-year, the picture is even clearer. Total retail sales grew 6.7% compared to June of the prior year, with the second quarter as a whole running 6.4% ahead of the same period last year.

Motor vehicles and online retail were called out as particular bright spots, two categories that tend to reflect genuine discretionary confidence rather than inflation-driven price increases.

The labor market is backing up the spending data

Weekly jobless claims fell to 208,000, the lowest reading since May 2026. Jobless claims are one of the more real-time economic indicators available, reported weekly with a short lag. A reading at 208,000 sits comfortably in what most economists would consider healthy territory, suggesting that layoffs remain contained even as interest rates have stayed elevated for an extended period.

What this means for investors navigating consumer exposure

The 6.7% year-over-year growth figure reflects durable demand, the kind that tends to support revenues for retailers, discretionary brands, and the payment networks that sit underneath all of it.

The control group’s 0.5% gain is the figure that will get the most attention from GDP trackers. A strong control group reading in the final month of a quarter tends to lift nowcast estimates for personal consumption expenditure, which is the single largest component of US GDP.

Disclosure: This article was edited by Editorial Team. For more information on how we create and review content, see our Editorial Policy.