 Earn with Nexo

VeChain Engagement Explodes, VET on Critical Price Support
Breaking below $0.0065 could trigger a 25% drop
VeChain community engagement metrics have exploded over the past month. Nevertheless, VET trading indicators show price weakness.
VeChain’s Community Overwhelmingly Engaged
VeChain’s social engagement has been skyrocketing over the past month, according to crypto insights provider LunarCRUSH. The firm reported that VET saw the first significant spike on Jan. 29, with over 1.16 million engagements on that day alone. However, the month of February has seen even greater engagement.
“VeChain social engagement has been very heavy with spikes as high as 3,520,412 engagements per day,” they said.
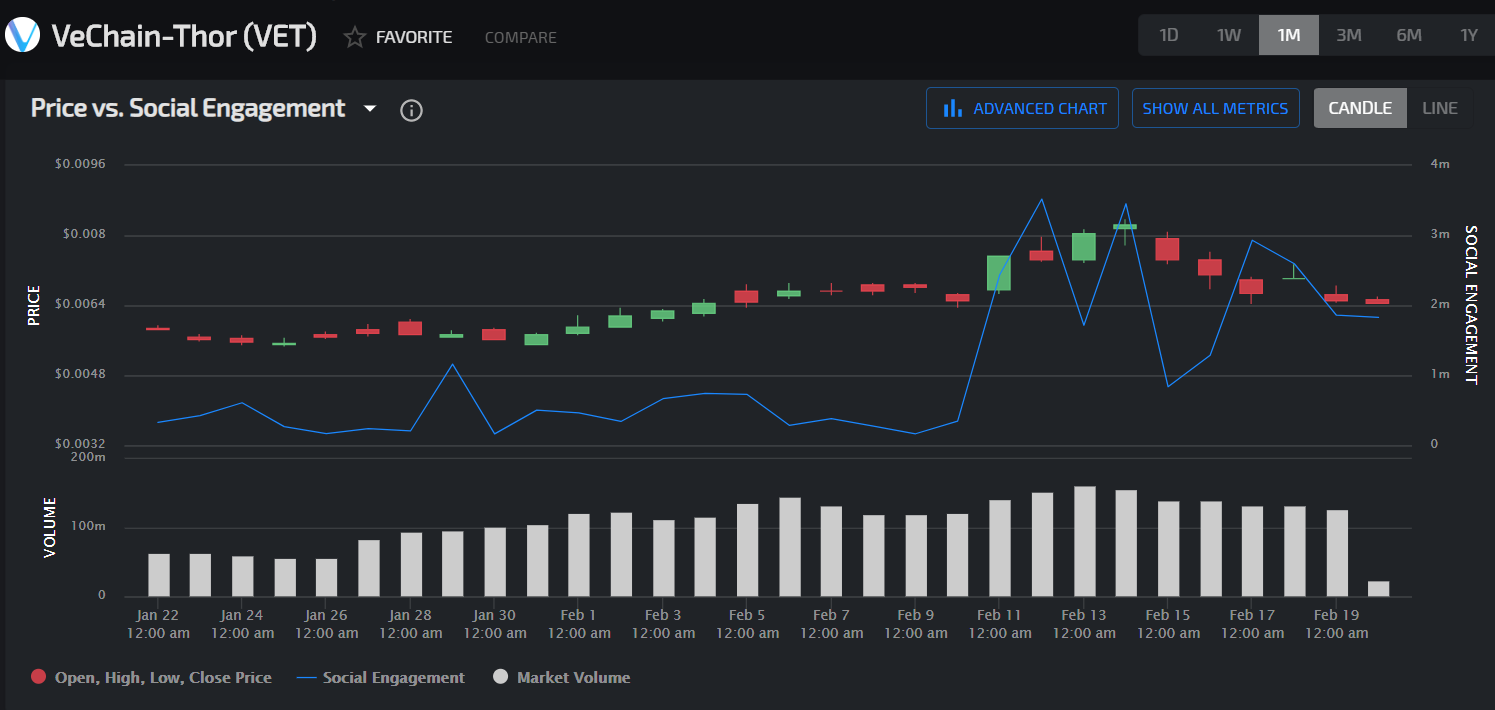
The California-based company takes into consideration the depth of community interaction across all social posts. These include favorites, likes, comments, replies, retweets, quotes, shares, and other metrics. LunarCRUSH maintains that these measures help determine how engaged a community is around a particular digital asset.
Over the last 24 hours, approximately 78% of all the social interactions across multiple platforms have been bullish about VeChain, based on data from LunarCRUSH. Despite the optimism, VET plummeted over 12% during the same time. Now, a technical pattern is estimating a further drop.
Signs of Further Retracement
VeChain entered a bull trend in the beginning of the year that saw its price rise by nearly 70%. However, it appears to have reached an exhaustion point on Feb. 15, triggering a 26% retracement. VET went from trading at a high of $0.0085 to recently hit a low of $0.0063.
Even though this correction seems quite significant, VeChain could be preparing for a steeper decline.
Based on its 4-hour chart, a head-and-shoulders pattern appears to be developing. Some of the most prominent analysts in the space consider this technical formation to be one of the most reliable trend reversal patterns.
VeChain is currently being held by its 200-four-hour moving average on the 4-hour chart. This is also where the neckline of the head-and-shoulders pattern sits. Breaking below this important support cluster could ignite a sell-off that pushes the price of this cryptocurrency down over 25% to $0.0047.
This target is determined by measuring the distance between the head and the neckline and adding that distance down from the breakout point.
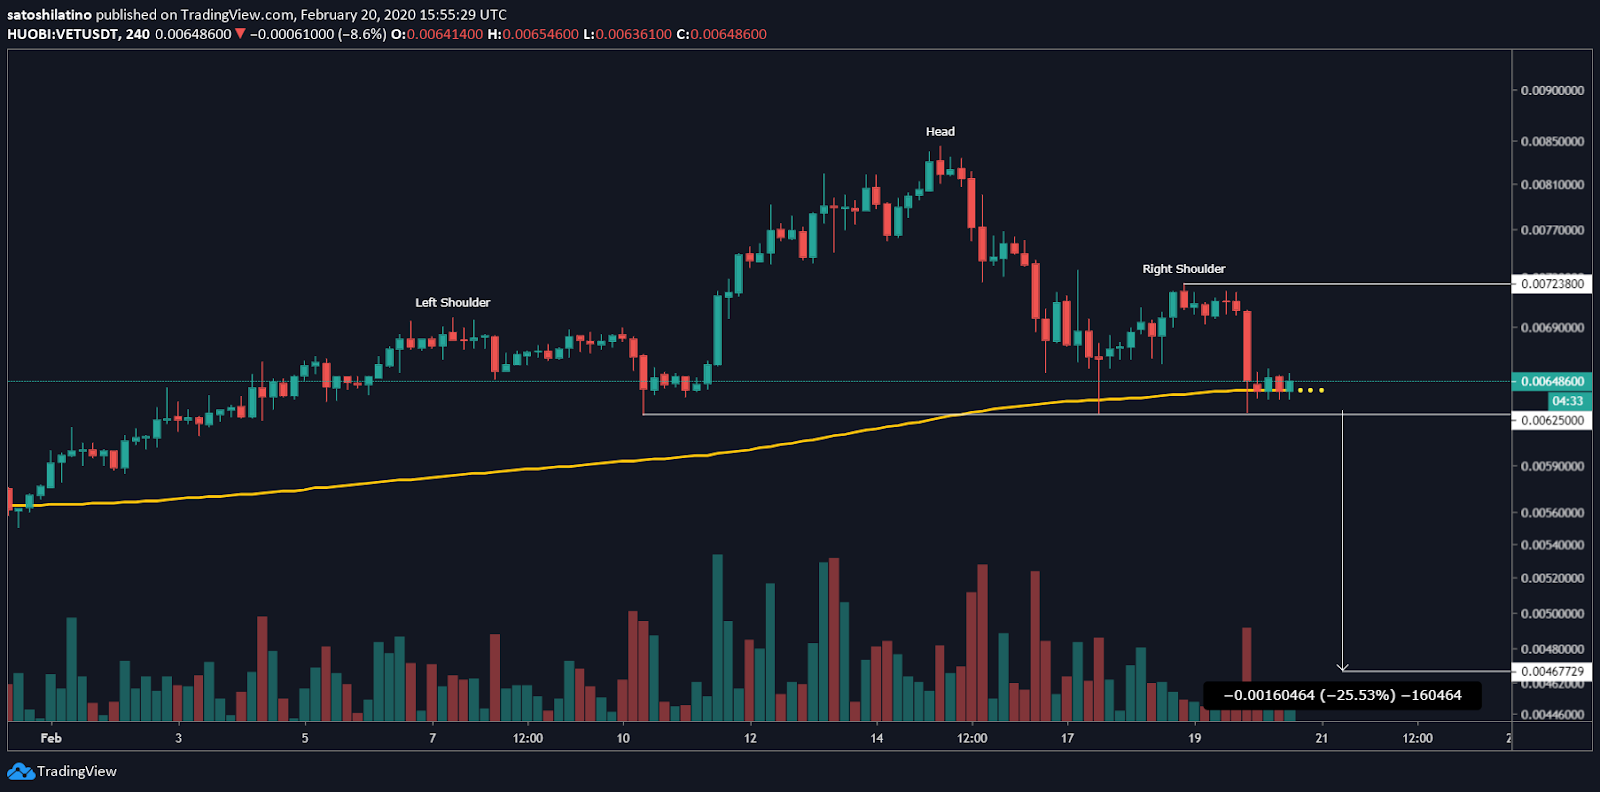
Nonetheless, an increase in the buying pressure behind VeChain that allows it to close above the height of the right shoulder at $0.0072 could invalidate the head-and-shoulders pattern. Such a bullish impulse would likely take this cryptocurrency to new yearly highs since the next significant level of resistance sits at $0.0099.
Moving Forward
VeChain was one of the many cryptocurrencies that benefited from Chinese President Xi Jinping’s decision to embrace blockchain technology in late October 2019. Since then, it was revealed that the firm’s blockchain-as-a-service platform, ToolChain, was expanding its uses into a wide range of industries in China.
From a drug traceability, monitoring, security, and auditing solution to a cross-continental logistics and trades platform, the VeChain Foundation is certainly making strides to increase the utility of its token. This could be the reason why its community appears to be so optimistic about its future.
Regardless of efforts put up by the foundation, investors should pay close attention to the 200-four-hour moving average on VET’s 4-hour chart. The strength of this support barrier could determine whether this crypto will decline further or continue its bullish trend.