 Earn with Nexo

VeChain / USD Technical Analysis: Looking For Solid Footing
VET / USD Technical Analysis - VeChain's recent gains are unstable and will likely be reversed without more breakthroughs.
witho[vc_row][vc_column][vc_column_text]
- VeChain is bullish in the short-term following a strong upside break from a descending wedge pattern
- Medium-term picture for VeChain is neutral, with the cryptocurrency pressing against its 100-day moving average
- Bullish MACD divergence is present on the daily time frame
VeChain / USD Short-term price analysis
In the short-term, VeChain / USD has turned bullish following a strong upside breakout from a descending wedge pattern on the four-hour time frame.
A minor downside correction is currently underway in the VET / USD pair, with technical indicators starting to turn lower. Bearish MACD price divergence is also present on the four-hour time frame.
Traders should also be aware that a move above the January 23rd trading high will likely spark the next bullish up move in the VET / USD pair.
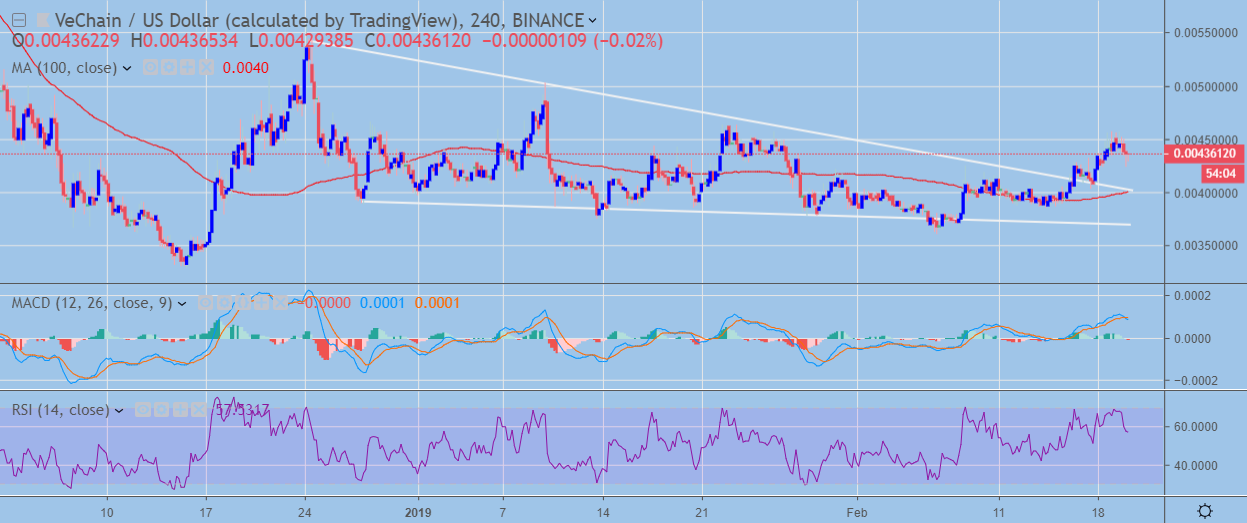 VET / USD H4 Chart (Source: TradingView)
Pattern Watch
Aside from the descending wedge pattern, a bullish inverted head and shoulders pattern is also visible on the four-hour time frame, with price trading close to the neckline of the pattern.
MACD Indicator
The MACD indicator on the four-hour time frame is turning bearish, with bearish MACD price divergence present up until trendline support.
Relative Strength Index
The RSI indicator is coming under pressure and is turning lower on the four-hour time frame.
VeChain / USD Medium-term price analysis
In the medium-term, VeChain has a neutral trading bias with the cryptocurrency pressing up against its 100-day moving average.
A sustained break above the 100-day will provoke a strong sentiment shift towards the VET / USD pair.
Bullish MACD price divergence remains present on the daily time frame, with the cryptocurrency set for a substantial rally if the bullish divergence is fully negated.
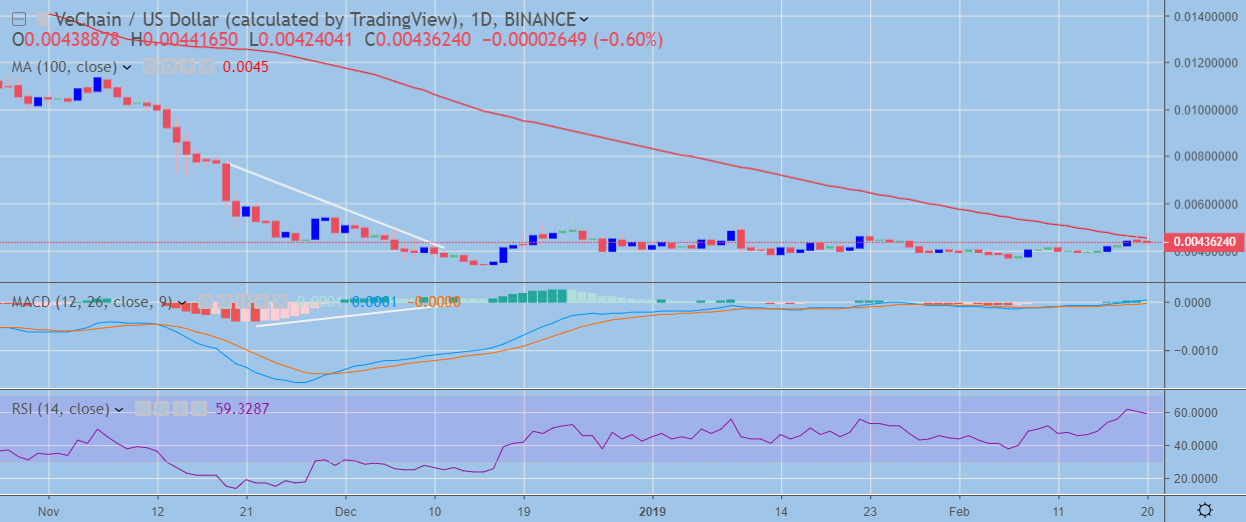 VET / USD Daily Chart (Source: TradingView)
Pattern Watch
A potential double-bottom pattern may have formed on the daily time frame.
MACD Indicator
The MACD indicator is trending higher and has turned bullish on the daily time frame.
Relative Strength Indicator
The RSI indicator appears overstretched on the daily time frame.
Conclusion
VeChain looks set for a pullback over the near-term, although the cryptocurrencies medium-term outlook is changing for the better.
A strong move above the pair’s 100-day may help to trigger the inverted head and shoulders pattern on the four-time frame.
The scope for upside potential in the VET / USD pair is considerable given the bullish price divergence present on the daily time frame.
Decentral Media, Inc., the publisher of Crypto Briefing, is not an investment advisor and does not offer or provide investment advice or other financial advice. Nothing on this website constitutes, or should be relied on as, investment advice or financial advice of any kind. Specifically, none of the information on this website constitutes, or should be relied on as, a suggestion, offer, or other solicitation to engage in, or refrain from engaging in, any purchase, sale, or any other any investment-related activity with respect to any transaction. You should never make an investment decision on an investment based solely on the information on our website, and you should never interpret or otherwise rely on any of the information on this website as investment advice. We strongly recommend that you consult a licensed investment advisor or other qualified financial professional if you are seeking investment advice on an investment.
[/vc_column_text][/vc_column][/vc_row]