 Earn with Nexo

Verge Price Analysis XVG / BTC: Showing Signs Of Life
Verge's latest update is showing signs of life, but its outlook remains extremely bearish in the long term.
- Verge has a neutral short-term bias against Bitcoin, following a technical correction back towards its 200-period moving average on the four-hour time frame
- The XVG / BTC pair is technically bearish over the medium-term
- The daily time frame continues to show bullish MACD price divergence
Verge / Bitcoin Short-term price analysis
Verge has a neutral short-term trading outlook, with the cryptocurrency testing towards its 200-period moving average on the four-hour time frame.
The four-hour time frame shows that a head and shoulders pattern has been triggered, with the bearish pattern already reaching its full downside projection.
Technical indicators on the four-hour time frame are bullish, although they are already starting to appear overstretched.
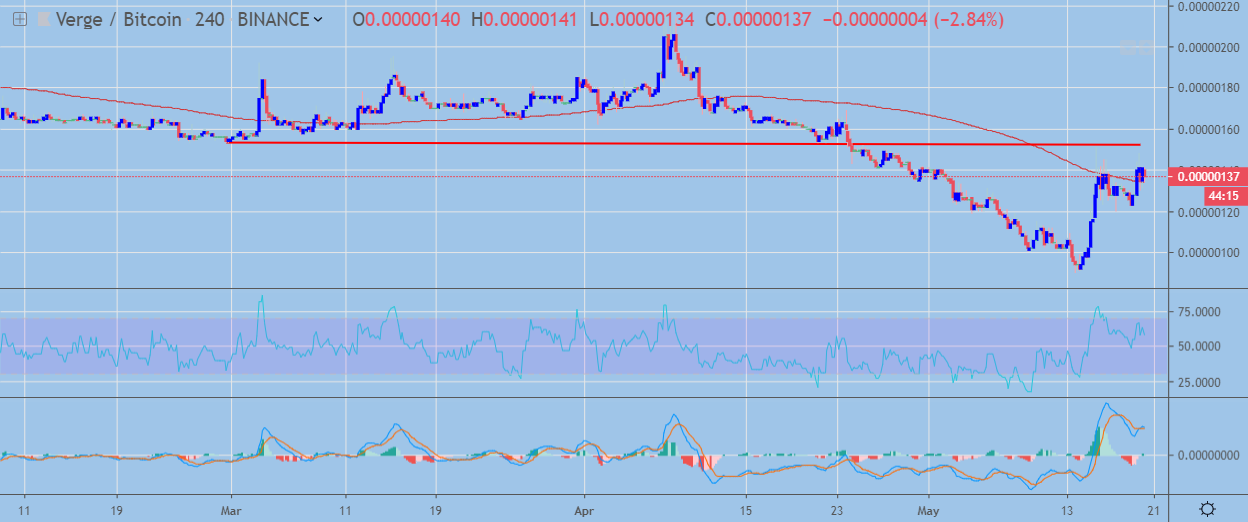 XVG / BTC H4 Chart by TradingView
Pattern Watch
Traders should continue to monitor the neckline of the bearish head and shoulders pattern on the four-hour time frame.
Relative Strength Index
The Relative Strength indicator has turned bullish on the four-hour time frame, although it is now starting to correct lower.
MACD Indicator
The MACD indicator has turned bullish on the four-hour time frame, although it is now starting to appear overstretched.
Fundamental Analysis
XVG continues its move up after the project has announced the release of its Lumos V5.0 update. As stated, the update increases the security of its privacy based platform and significantly improves the performance of certain tasks, creating a better user experience.
Verge / Bitcoin Medium-term price analysis
Verge has turned bearish over the medium-term, with the XVG / BTC pair now trading above its trend-defining 200-day moving average.
The daily time frame shows a bearish triple-top formation, following numerous failed attempts by XVG / BTC bulls to surpass the November 2018 trading high.
Technical indicators on the daily time frame have turned bullish and continue to generate strong buy signals.
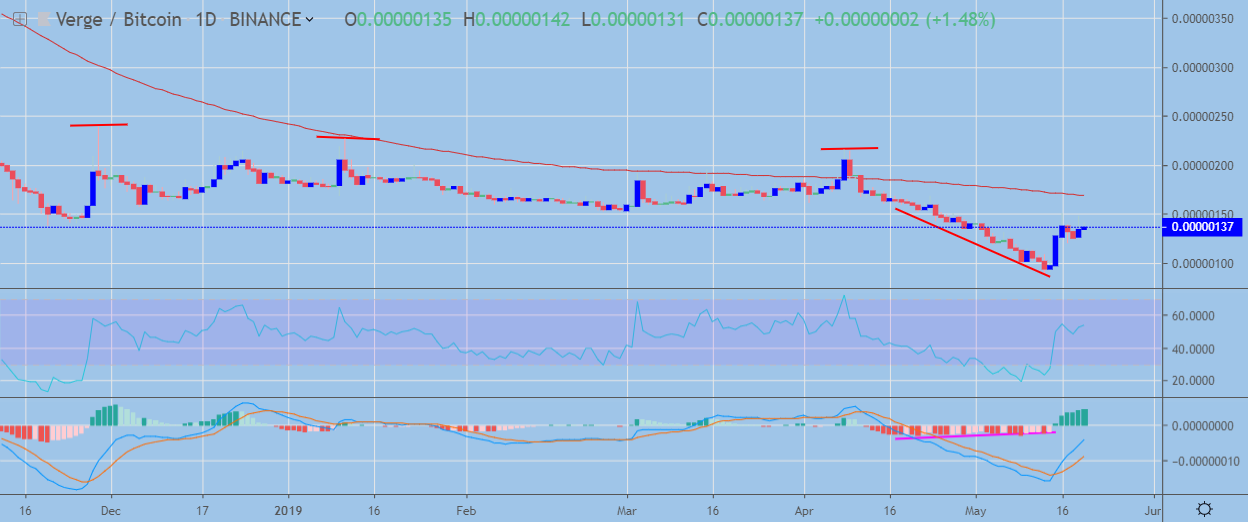 XVG / BTC Daily Chart by TradingView
Pattern Watch
Traders should note that a small head and shoulders pattern is also visible on the daily time frame.
Relative Strength Index
The Relative Strength indicator has turned bullish on the daily time frame and is highlighting the growing medium-term upside pressure.
MACD Indicator
The MACD indicator is generating a strong buy signal on the daily, while bullish MACD divergence still remains present on the mentioned time frame.
Fundamental Analysis
In the medium term, the project will continue to face stiff competition from other privacy-based coins. The sector is becoming more competitive while Verge is losing the technological competition to large players, such as Monero and Zcash.
Conclusion
Verge is attempting to correct higher against Bitcoin after the bearish patterns across both time horizons caused the XVG / BTC pair to fall to a new 2019 trading low.
While the medium-term trend remains bearish, further near-term gains appear possible as the bullish MACD divergence on the daily time frame has yet to be fully reversed.