 Earn with Nexo

Waltonchain Price Analysis WTC / USD: Against The Current
WTC is bullish in opposition to the rest of the market.
- Waltonchain has a bullish short-term trading bias, with the cryptocurrency bouncing from major technical support
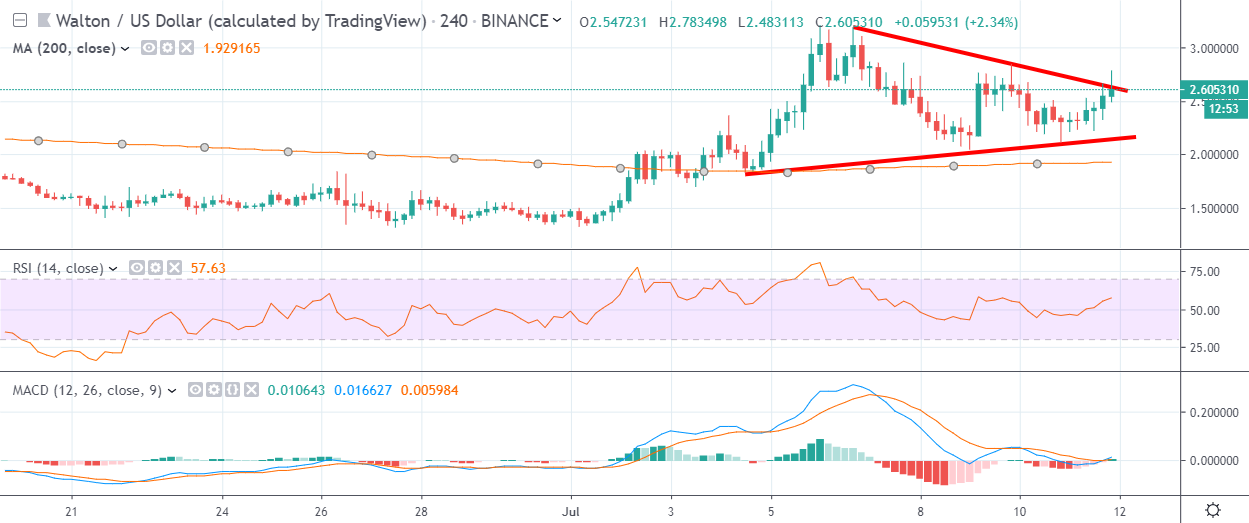
- The four-hour time frame shows that the WTC / USD pair is attempting to breakout from a neutral triangle pattern
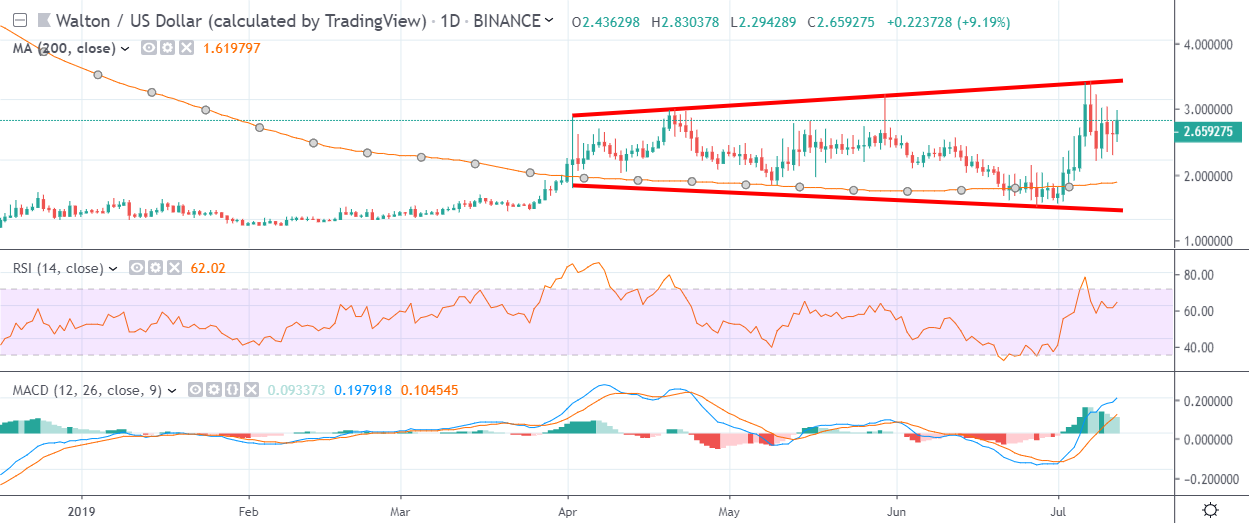
- The daily time frame shows that the cryptocurrency is trapped within a broadening wedge pattern
Waltonchain / USD Short-term price analysis
Waltonchain has a bullish short-term trading bias, with the WTC / USD pair still trading above major support on the four-hour time frame.
The four-hour time frame shows that the WTC / USD pair is attempting a bullish breakout from a neutral triangle pattern, following a failed downside attempt.
Technical indicators on the four-hour time frame currently have a slight bullish bias.
Pattern Watch
Traders should note that the current 2019 trading high will come into focus if the bullish triangle breakout on the four-hour time frame is successful.
The Relative Strength Index
The RSI indicator on the four-hour time frame is bullish and is starting to issue a buy signal.
MACD Indicator
The MACD indicator on the four-hour time frame is neutral and currently failing to generate a clear trading signal.
Waltonchain / USD Medium-term price analysis
Waltonchain has a bullish medium-term outlook and continues to trade well above its trend defining 200-day moving average.
The daily time frame shows that a broadening wedge pattern has formed, with the WTC / USD pair attempting to move back towards key trendline resistance.
Technical indicators on the daily time frame are bullish and continue to issue a buy signal.
Pattern Watch
Trades should note that broadening wedge patterns typically breakout in the direction of the overall trend.
Relative Strength Index
The RSI indicator on the daily time frame is bullish and is continuing to issue a medium-term buy signal.
MACD Indicator
The MACD indicator is bullish on the daily time frame and continues to generate a buy signal.
Conclusion
Waltonchain is attempting a bullish breakout on the four-hour time frame, following an impressive technical rebound from major trendline support.
The broadening wedge pattern on the daily time suggests that in-line with the prevailing bullish trend, a medium-term upside breakout appears the most likely scenario for the WTC / USD pair.
Check out the Waltonchain coin guide.