Waves Price Analysis WAVES / USD: Gravitational Flux
Waves' price has got a double-digit increase.

Share this article
- Waves has staged its strongest daily rally since early July
- The WAVES / USD pair has turned bullish over the short-term but remains bearish over the medium-term
- Technical indicators are signaling more gains for the cryptocurrency
Waves a staged an impressive double-digit upside rally as the new trading week gets underway, leaving the cryptocurrency on course to post its largest daily advance since early July this year. The recent rally has also helped the WAVES / USD pair to break through a series of key short-term moving averages.
After moving to a new all-time trading high in late 2018, the cryptocurrency has repeatedly fallen short of its 2018 trading peak this year. In fact, aside from two notable intraday rallies during April and late May this year, the WAVES / USD pair has notably underperformed the broader cryptocurrency market.
Since January 1st this year the WAVES / USD is currently trading down around sixty percent, while the cryptocurrency is trading around twenty percent higher than its lowest ever trading level, which was created just last week.
The technicals are currently showing that the WAVES / USD pair still has significant ground to cover before it regains its bullish medium-term status. The cryptocurrency has recently turned bullish over the short-term, although a lack of bullish patterns suggests the rally could easily start to fade as the broader long-term trend remains bearish.
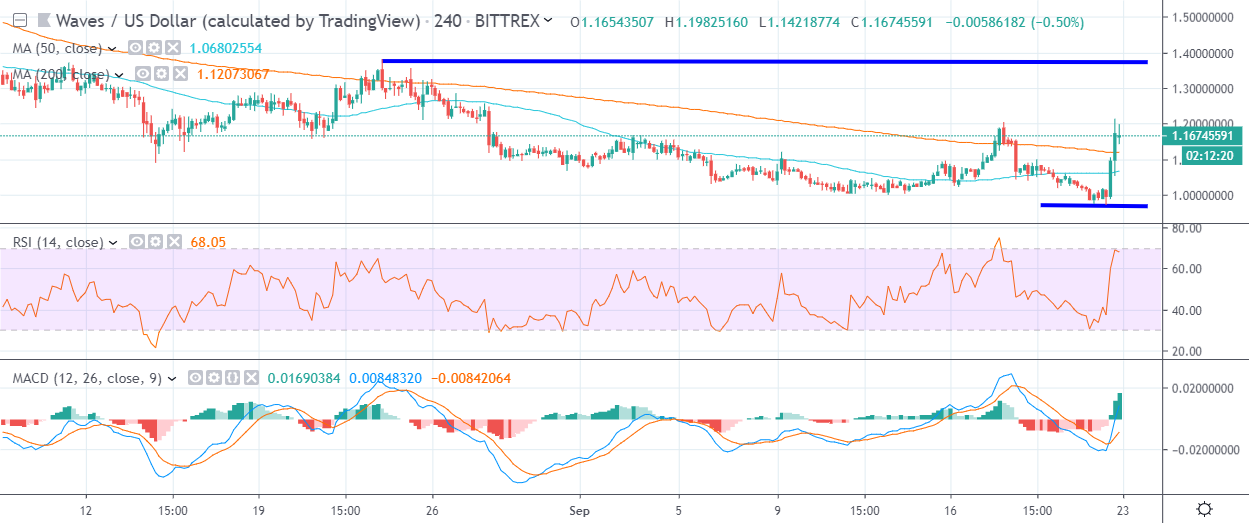
The four-hour time frame is showing that the WAVES / USD pair has recovered above its 50-period and 200-period moving averages, with the cryptocurrency needing to rally towards the $1.36 level to form a bullish inverted head and shoulders pattern.
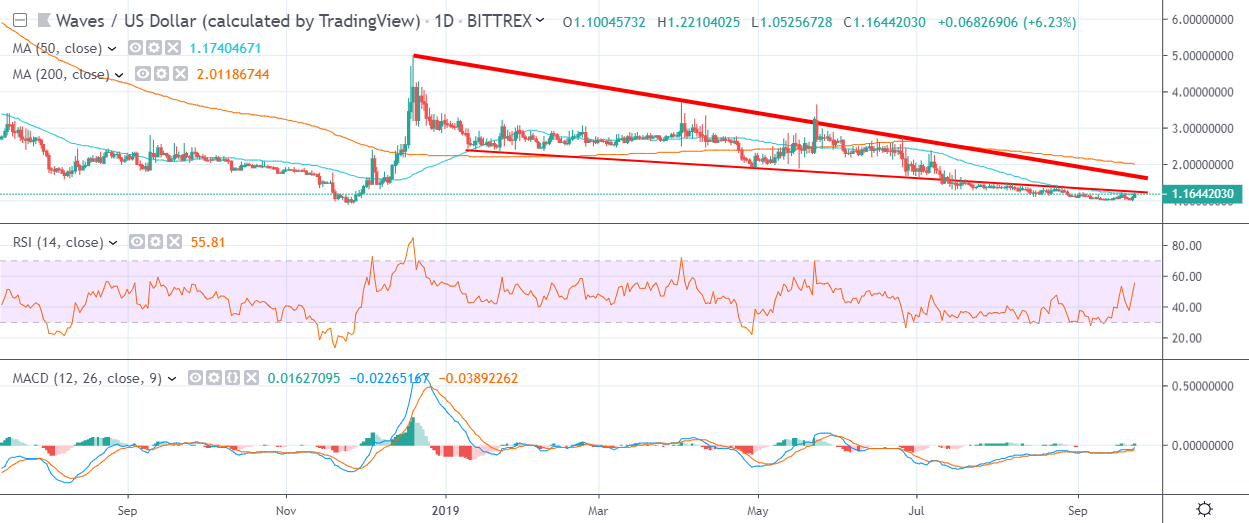
Interestingly, the daily time frame shows a large falling wedge pattern, with the cryptocurrency attempting to break back inside the pattern. Sellers previously failed to take advantage of bearish breakout from the wedge pattern, which may suggest a possible attempt to ignite the bullish reversal pattern to the upside.
The daily time frame currently shows that a bullish breakout from the falling wedge pattern will occur if price moves above the $1.50 level, which would mean the WAVES / USD pair would need to rally more than thirty percent from current levels to reach the $1.50 level target.
According to the latest sentiment data from TheTIE.io, the short-term sentiment towards Waves is bullish, at 68.00 %, while the overall long-term sentiment towards the cryptocurrency is very bearish, at 23.00%.

Upside Potential
The four-hour time frame is showing that the WAVES / USD pair has moved above all key short-term moving averages, leaving the August 24th swing-high as the strongest form of near-term resistance.
The daily time frame highlights the 50-day and 200-day moving averages as the key resistance areas bulls need to clear in the medium-term. The WAVES / USD pair’s 200-day moving average is currently some distance away, around the $2.00 level.

Downside Potential
The four-hour time frame is showing that major short-term technical support is located around the $1.11 level. Key support under the $1.11 level is found at the $1.06 and $1.00 levels.
The daily time frame is currently showing that the WAVES / USD pair’s current yearly trading low as the strongest form of medium-term technical support, around the $0.97 level.
Summary
Waves has staged an explosive double-digit rally, with bulls now probing against major trendline resistance on the daily time frame.
Due to the heavy losses incurred over the course of year, the cryptocurrency still has significant work ahead to secure its medium-term prospects.
Check out our coin guide for Waves.
We wrote several analytical reports on Waves, including the initiation and updates.
