 Earn with Nexo

Zcash / USD Technical Analysis: Recovery In Progress
ZEC / USD Technical Analysis - Bulls are making progress and could invalidate ZEC's bearish head and shoulders pattern.
[vc_row][vc_column][vc_column_text]
- Zcash is bullish in the short-term, with price trading above its 200-period moving average on the four-hour time
- Short-term bulls are moving closer to invalidating a bearish head and shoulders pattern
- The daily time frame continues to highlight the bullish breakout underway from descending price channel
Zcash / USD Short-term price analysis
Zcash is bullish over the short-term, with the ZEC / USD pair trading well above its 200-period moving average on the four-hour time frame.
A bearish head and shoulders pattern remains valid on the four-hour time frame, although short-term bulls are working hard to negate it.
Technical indicators across the four-hour time horizon are growing increasingly bullish as the advance gathers pace.
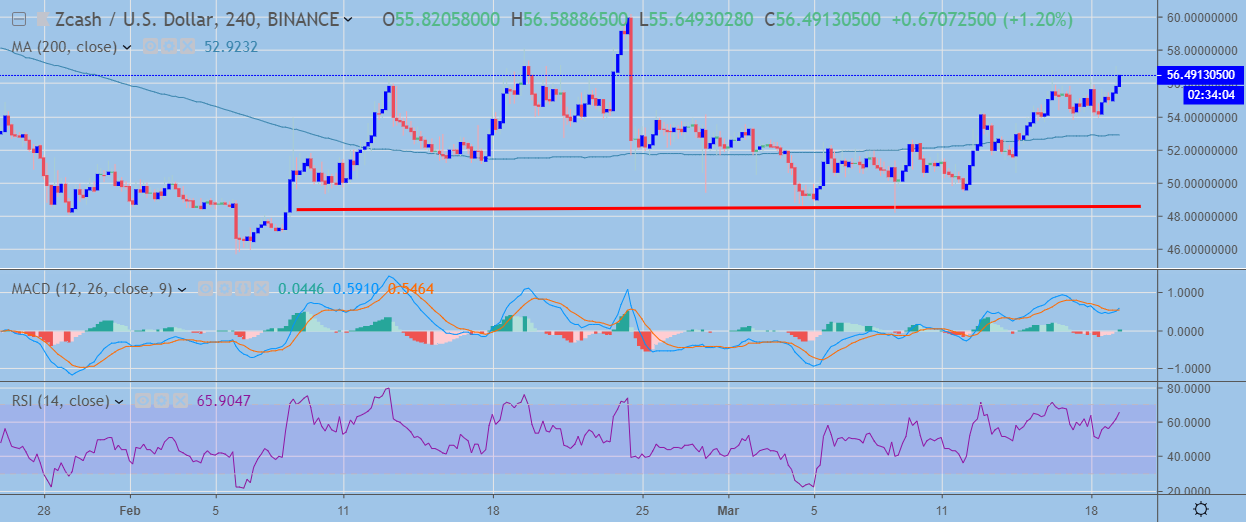 ZEC / USD H4 Chart (Source: TradingView)
Pattern Watch
The December 24th trading high from last year offers a solid bullish target if buyers can invalidate the bearish head and shoulders pattern on the four-hour time frame.
MACD Indicator
The MACD indicator on the four-hour time frame is showing that bullish pressures are building.
Relative Strength Index
The RSI indicator on the four-hour time frame is currently generating a buy signal.
Zcash / USD Medium-term price analysis
ZCash has a neutral trading outlook over the medium-term, with the ZEC / USD pair still unable to move above its 200-day moving average.
The daily time frame also shows that the ZEC / USD pair has continued to move away from the large descending price channel, although bullish momentum remains fairly weak.
Buyers need to force price above the ZEC / USD pair’s former monthly trading high, in order to spark the next wave of technical buying interest.
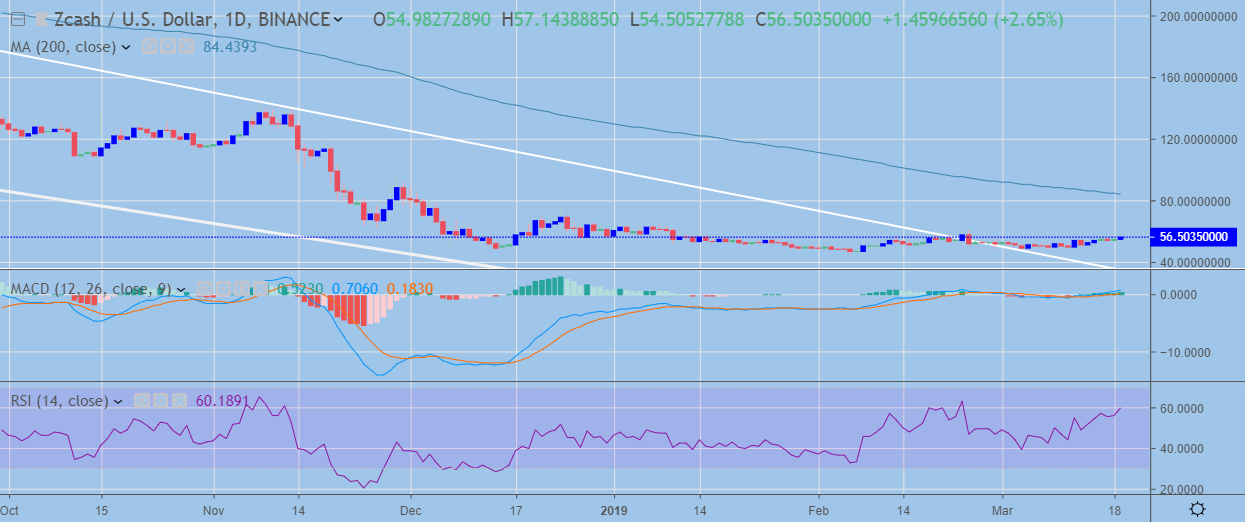 ZEC / USD Daily Chart (Source: TradingView)
Pattern Watch
Traders should continue to monitor the trading activity around the upper trendline of the descending price channel on the daily time frame.
MACD Indicator
The MACD indicator on the daily time frame is currently generating a strong bullish trading signal.
Relative Strength Index
The RSI indicator is bullish on the daily time frame and highlights that buying interest is increasing.
Conclusion
The overall outlook for Zcash continues to improve, with bullish pressure increasing across both time horizons.
If bulls can invalidate the bearish pattern on the four-hour time frame the ZEC / USD pair could start to advance towards the December 24th trading high, with its trend-defining 200-day moving average being the strongest form of resistance above.
Decentral Media, Inc., the publisher of Crypto Briefing, is not an investment advisor and does not offer or provide investment advice or other financial advice. Nothing on this website constitutes, or should be relied on as, investment advice or financial advice of any kind. Specifically, none of the information on this website constitutes, or should be relied on as, a suggestion, offer, or other solicitation to engage in, or refrain from engaging in, any purchase, sale, or any other any investment-related activity with respect to any transaction. You should never make an investment decision on an investment based solely on the information on our website, and you should never interpret or otherwise rely on any of the information on this website as investment advice. We strongly recommend that you consult a licensed investment advisor or other qualified financial professional if you are seeking investment advice on an investment.
[/vc_column_text][/vc_column][/vc_row]