 Earn with Nexo

Zilliqa Price Analysis ZIL / USD: Jumping Above The Average
Fundamental news about Zilliqa smart contracts have triggered a recovery, which put the pair on a bullish course.
- Zilliqa has a bullish short-term bias, with the cryptocurrency advancing to a new monthly trading high
- The ZIL / USD pair has a bullish medium-term outlook and is now trading above its key 200-day moving average
- The daily time frame is showing that a large bullish pattern may be forming
Zilliqa / USD Short-term price analysis
Zilliqa has a bullish short-term outlook, with the cryptocurrency advancing to a fresh monthly trading high.
The four-hour time frame shows a valid head and shoulders pattern, with ZIL / USD bulls working hard to negate the bearish pattern following a false downside breakout.
Technical indicators across the four-hour time frame have turned bullish and continue to signal further upside gains for the ZIL / USD pair.
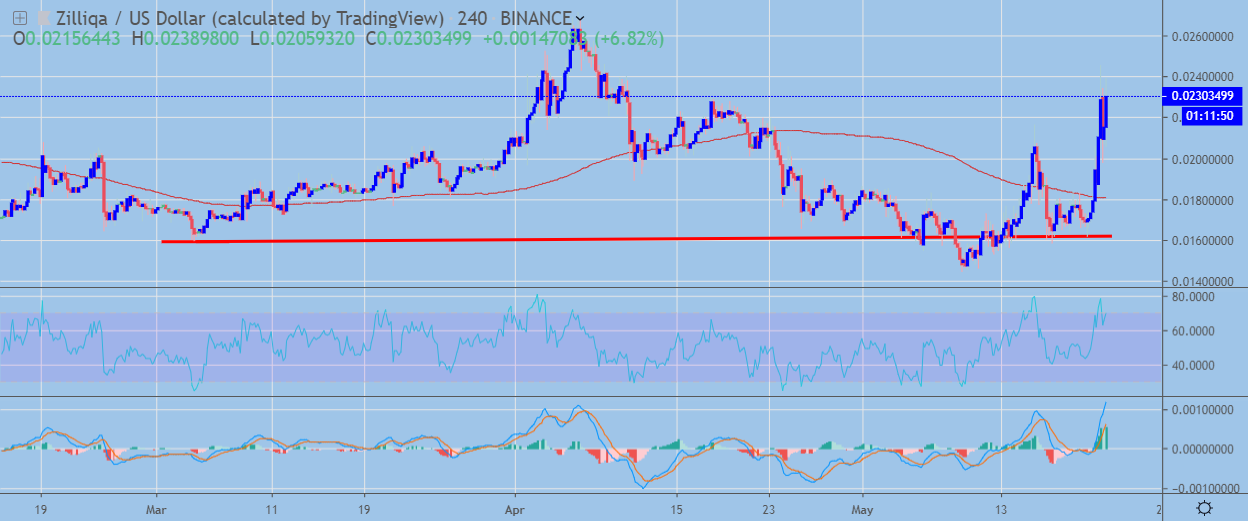 ZIL / USD H4 Chart by TradingView
Pattern Watch
Traders should note that a large inverted head and shoulders pattern will form if the bearish pattern is negated on the four-hour time frame.
Relative Strength Index
The RSI indicator is bullish on the four-hour time frame, although it is now correcting from extreme overbought conditions.
MACD Indicator
The MACD indicator is bullish on the four-hour time frame and continues to issue a strong buy signal.
Fundamental Analysis
Zilliqa is steadily gaining momentum after the news that the project is getting ready to enable smart contracts on June 10. The project has also reported that the Ledger support for native ZIL tokens is underway, which also had a positive effect on the price.
Zilliqa / USD Medium-term price analysis
Zilliqa has a bullish medium-term bias, with the cryptocurrency recovering back above its trend-defining 200-day moving average.
The daily time frame is showing that a complex inverted head and shoulders pattern may be forming, following the recent strong advance in the ZIL / USD pair.
Technical indicators on the daily time frame are turning higher and show scope for further upside gains.
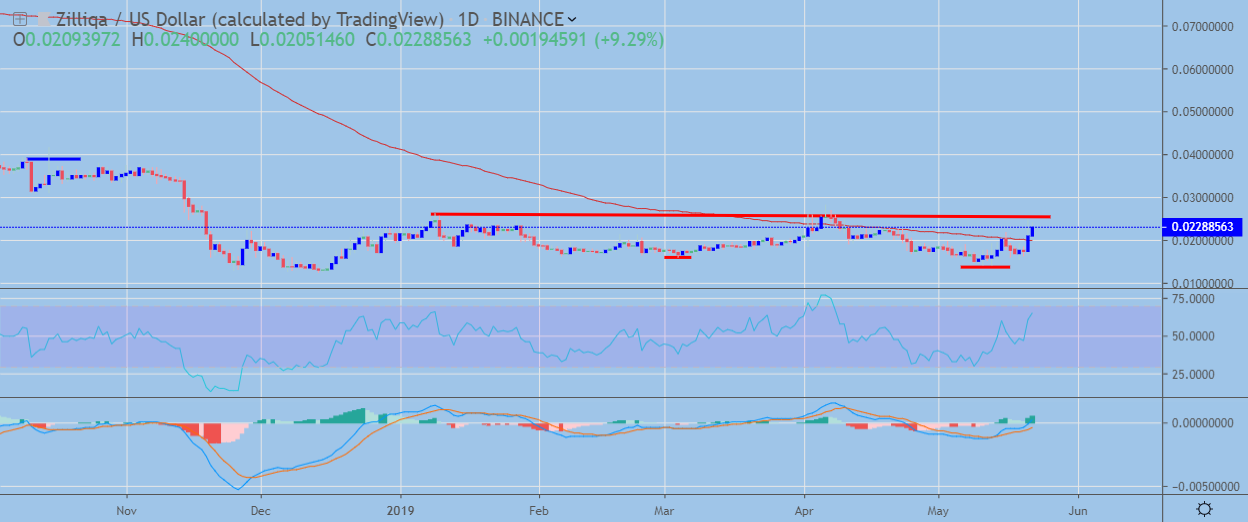 ZIL / USD Daily Chart by TradingView
Pattern Watch
Traders should note that the October 2018 swing-high may be the upside target of the potential inverted head and shoulders pattern on the daily time frame.
Relative Strength Index
The Relative Strength indicator is bullish on the daily time frame and is highlighting the growing medium-term strength in the ZIL / USD pair.
MACD Indicator
The MACD indicator is bullish on the daily time frame, with both the MACD signal line and histogram generating buy signals.
Fundamental Analysis
Although for the past six months Zilliqa has shown some clear signs of development, its ecosystem remains small. The project needs to start implementing its pilot programs into viable adoption use cases, otherwise it will continue to lag behind large networks.
Conclusion
Zillaqa has staged an impressive upside recovery, with the cryptocurrency shifting its medium-term trading bias and advancing above its 200-day moving average.
If buyers can negate the bearish pattern on the four-hour time frame a much larger bullish pattern will start to form on the daily time frame.
Check out our coin guide for Zilliqa for a brief overview.
We also published a deeper overview of the project in our Zilliqa DARE.