 Earn with Nexo

BAT / USD Price Analysis: Lost Momentum
Basic Attention Token is under heavy pressure as the outlook turns negative on all time frames, though some supports maintain it above water.
- Basic Attention Token has a neutral short-term trading bias, with the cryptocurrency falling back towards critical technical support
- BAT has a bullish medium-term outlook, with price trading well above the pair’s 200-day moving average
- Bearish MACD price divergence remains present on the daily time frame
Basic Attention Token / USD Short-term price analysis
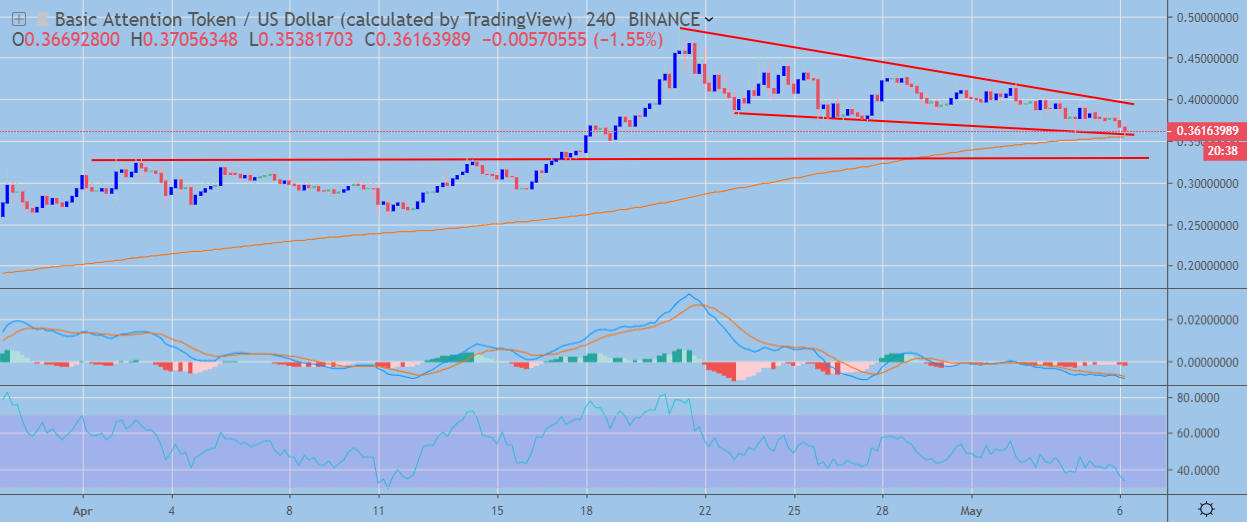
BAT has a neutral short-term trading bias, with the BAT / USD pair falling back towards critical technical support on the four-hour time frame.
The four-hour time frame is currently showing a valid falling wedge pattern, with BAT / USD sellers attempting to force price below the bullish pattern.
Technical indicators on the four-hour time frame are bearish, although they appear overstretched.
 BAT / USD H4 Chart by TradingView
Pattern Watch
Traders should note that a bearish head and shoulders pattern may start to take shape on the four-hour time frame if the decline in the BAT / USD pair continues.
Relative Strength Index
The RSI indicator on the four-hour time frame is also bearish, although it has reached oversold conditions.
MACD Indicator
The MACD indicator has turned bearish on the four-hour time frame and continues to generate a sell signal.
Basic Attention Token / USD Medium-term price analysis
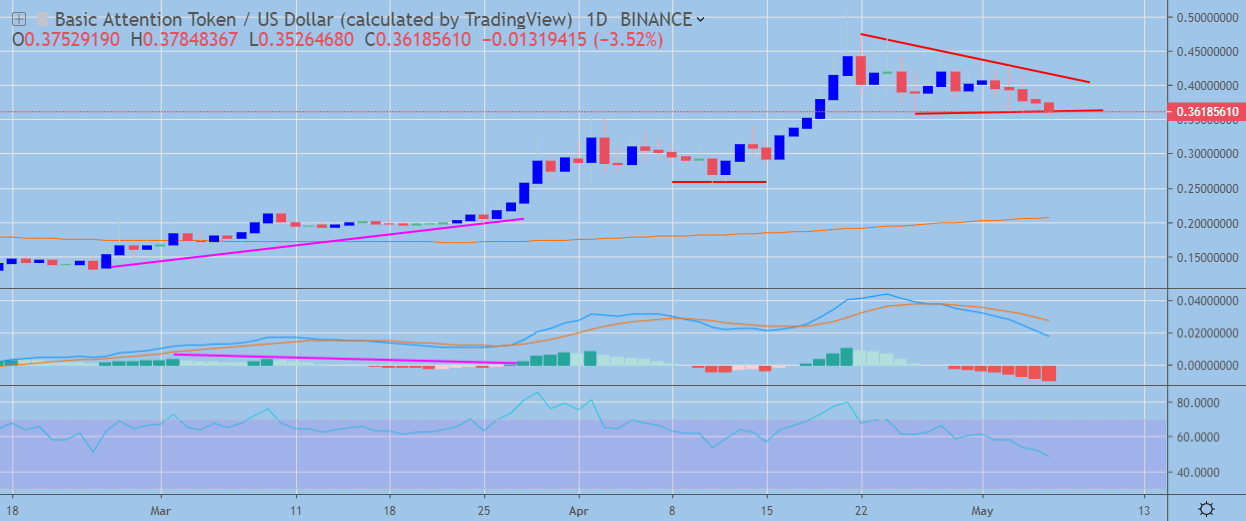
BAT has a bullish medium-term outlook, with the BAT / USD pair still trading well above its key 200-day moving average.
The daily time frame is showing that a descending triangle pattern has taken shape, with sellers attempting to force price below the bullish pattern.
Technical indicators have turned bearish on the daily time frame and continue to issue a strong sell signal.
 BAT / USD Daily Chart by TradingView
Pattern Watch
The BAT / USD pair may fall towards the April monthly trading low if a bearish technical breakout occurs.
Relative Strength Index
The RSI indicator has turned bearish on the daily time frame and shows scope for further downside.
MACD Indicator
The MACD indicator on the daily time frame is issuing a strong sell signal and shows bearish price divergence.
Conclusion
BAT is at risk of further near-term trading losses if sellers can force price below critical technical support on the four-hour time frame.
Bearish MACD divergence on the daily time frame is also warning that a much stronger downside correction could occur over the medium-term horizon.
Head over to our coin guide for BAT and the Brave Browser for an intro to the project.
Also, an in-depth dive into BAT is available in our DARE.