
Binance Coin Price Analysis BNB / USD: Announcements Galore
The market is reacting to CZ's stream of positive announcements.
- Binance Coin has a bearish short-term bias, with the cryptocurrency holding below key technical support
- The four-hour time frame is showing a valid head and shoulders pattern
- The daily time frame highlights that a significant bullish breakout is still underway
Fundamental Analysis
Binance Coin has gained bullish momentum after its CEO Changpeng Zhao has made several positive announcements during the recent AMA session on Twitter. The project is planning to burn all the team’s tokens, to launch margin trading, to introduce smart contracts to Binance Chain, to launch several new IEOs, etc. With all the positive developments the exchange has, the BNB token will likely continue to improve its positions amongst the top cryptocurrencies.
Binance Coin / USD Short-term price analysis
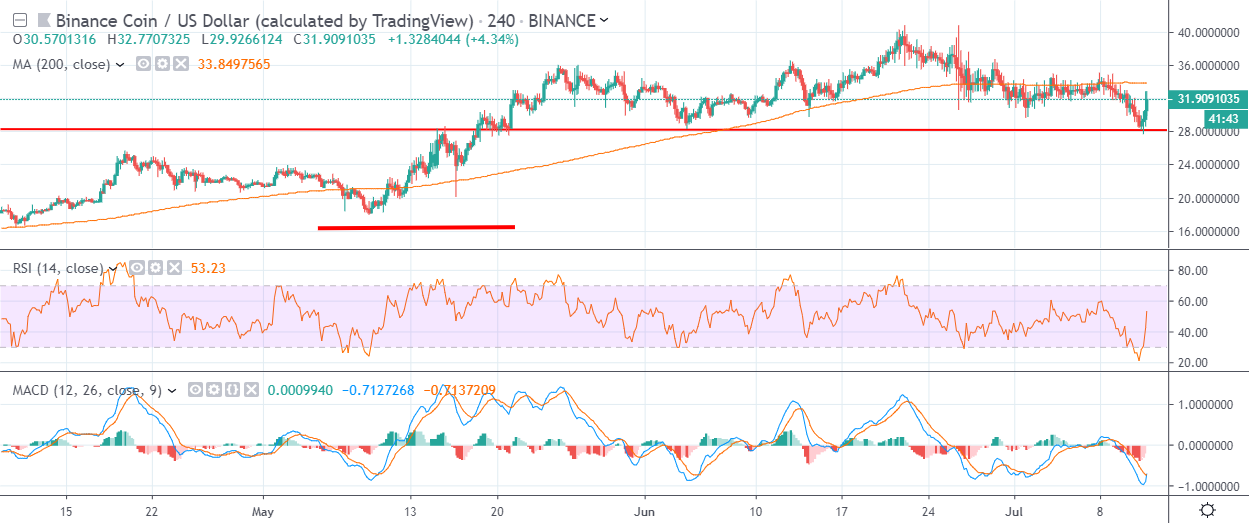
Binance Coin has a bearish short-term outlook, with the cryptocurrency now trading below its 200-period moving average on the four-hour time frame.
The four-hour time frame shows that a head and shoulders pattern has now formed, with the BNB / USD pair bouncing from the neckline of the bearish pattern.
Technical indicators on the four-hour time frame are attempting to recover higher alongside the recent bounce in the BNB / USD pair.
Pattern Watch
Traders should note that the April 11th 2019 trading low is the overall target of the bearish head and shoulders pattern on the four-hour time frame.
Relative Strength Index
The RSI Indicator is bullish on the four-hour time frame and is starting to recover above neutral.
MACD Indicator
The MACD indicator on the four-hour time frame is attempting to recover higher, although it has yet to issue a clear buy signal.
Binance Coin / USD Medium-term price analysis
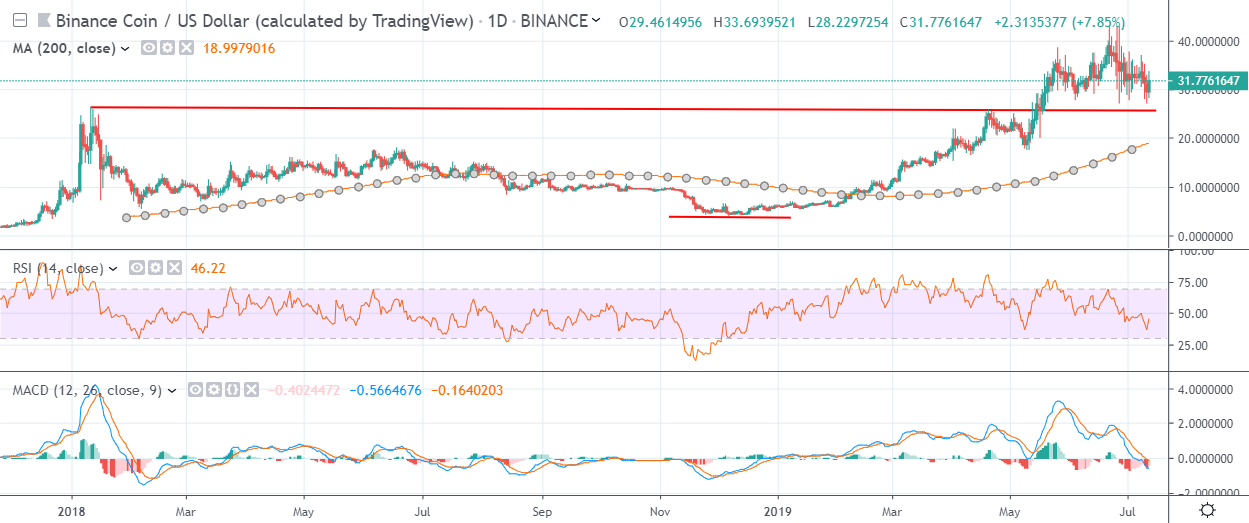
Binance Coin has a bullish medium-term outlook, with the BNB / USD pair still trading above critical support on the daily time frame.
The daily time frame continues to highlight that a significant bullish breakout is still underway, with the BNB / USD pair holding price above the neckline of a large inverted head and shoulders pattern.
Technical indicators have turned bearish on the daily time frame and are now issuing sell signals.
Pattern Watch
Traders should note that the 26.500 support level remains the key technical level to watch on the daily time frame.
Relative Strength Index
The RSI indicator is bearish on the daily time frame and still shows scope for further downside.
MACD Indicator
The MACD indicator on the daily time frame is bearish, with both the MACD histogram and signal line issue sell signals.
Conclusion
Binance Coin is attempting to recover bullish momentum on the four-hour time frame, following the recent drop in the BNB / USD pair, which created a bearish head and shoulders pattern
The medium-term bullish trend remains well intact, with both time frames highlighting the overall importance of the 26.500 level.
Check out our coin guide for BNB to understand how it works.
We also conducted a deep analysis of the Binance Exchange token in our DARE.