 Earn with Nexo

Bitcoin Cash / USD Technical Analysis: Merging Fork
The pair has seen a strong boost due the Bitcoin SV delisting, with all technical indicators being bullish.
- Bitcoin Cash has a bullish short-term bias, with the BCH / USD pair probing its current yearly trading high
- Bitcoin Cash has a bullish outlook over the medium-term horizon
- The daily time frame chart shows that any bullish MACD divergence has now been completely eradicated
Bitcoin Cash / USD Short-term price analysis
BitcoinCash has a bullish short-term trading bias, with the BCH / USD pair testing back towards its current yearly trading high, after a brief technical correction lower.
The four-hour time frame shows that BCH / USD buyers are now firmly back in control of the pair following a bullish breakout above a descending pattern.
Technical indicators on the four-hour time frame continue to rise alongside the latest advance.
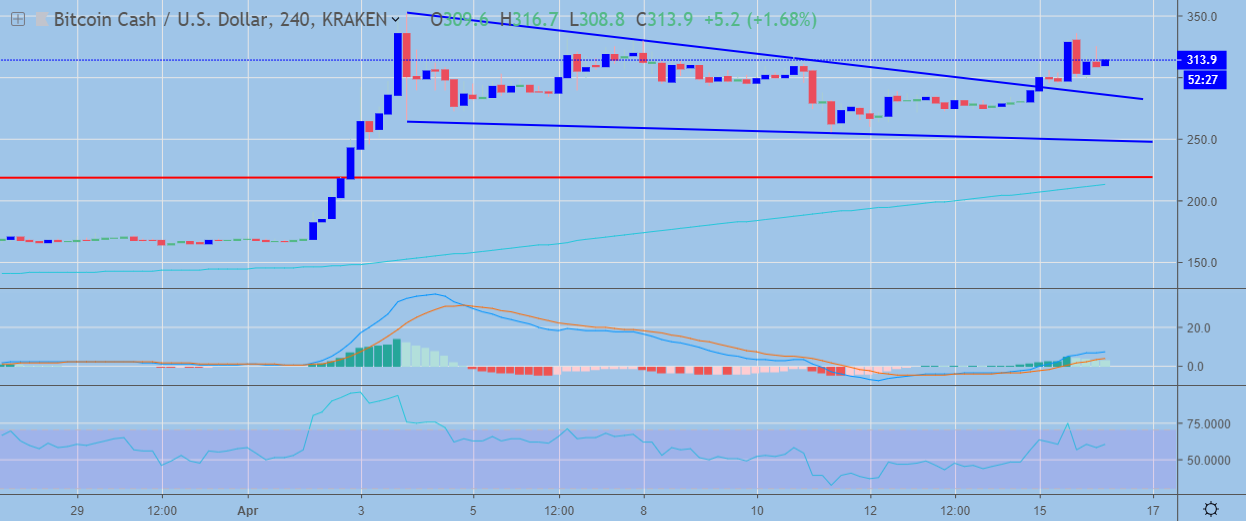 BCH / USD H4 Chart by TradingView
Pattern Watch
Traders should note that the four-hour time frame is also showing a potential inverted head and shoulders pattern that would take the BCH / USD pair towards the $400.00 level.
Relative Strength Index
The RSI indicator on the four-hour time is once again moving higher after a brief technical pullback.
MACD Indicator
The MACD indicator on the four-hour time frame is bullish, with the MACD signal line generating a buy signal.
Fundamental Analysis
Bitcoin Cash has been the biggest winner of the delisting announcement of its fork, Bitcoin SV, from Binance. The news has positively affected the price of the coin and the trend could continue, at least in the short term.
Bitcoin Cash / USD Medium-term price analysis
Bitcoin Cash has a bullish medium-term trading outlook, with the BCH / USD pair consolidating well above its trend defining 200-day moving average.
With the bullish MACD divergence on the daily time frame now reversed, and the bullish inverted head and shoulders pattern completed, Bitcoin Cash buyers are attempting to navigate past an area of strong technical resistance.
The daily time frame is also showing that the November 18th swing-high offers the strongest form of near-term resistance above the $350.00 level.
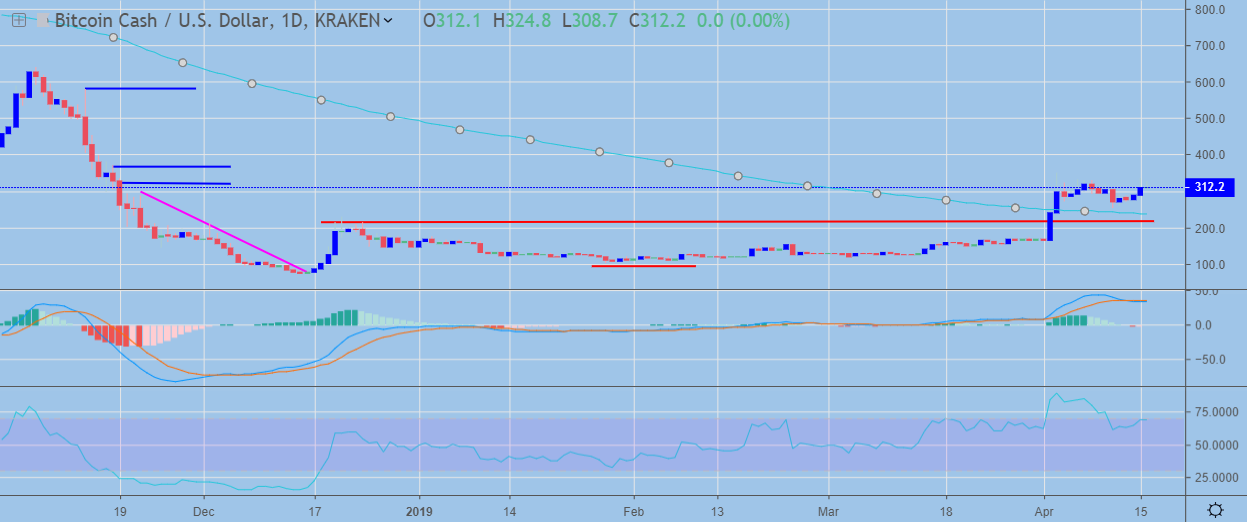 BCH / USD Daily Chart by TradingView
Pattern Watch
Traders should note that a bearish head and shoulders pattern could start to take shape if a strong technical correction occurs.
Relative Strength Index
The RSI indicator on the daily time frame remains bullish, although it is worth monitoring it for signs of a bearish double-top formation.
MACD Indicator
The MACD indicator on the daily time frame is starting to appear overstretched.
Fundamental Analysis
In the medium term, Bitcoin Cash remains a highly speculative coin. Although the project is supported by some of the biggest names in the cryptocurrency industry, it still lacks adoption and has largely failed to make use of its 32MB block size. In fact Bitcoin (BTC) blocks are, on average, much bigger than Bitcoin Cash (BCH) blocks.
Conclusion
Bitcoin Cash bulls are attempting to break through strong technical resistance and move the BCH / USD pair to a new 2019 trading high. The bullish patterns on the four-hour time frame also suggest the $400.00 level is a likely upside target.
If buyers fail to surpass the $350.00 level, traders should be on guard for a potential technical correction back towards the pair’s 200-day moving average.
Head over to our coin guide for Bitcoin Cash for an introduction to the project.