
Bitcoin Cash Price Analysis BCH / USD: Rallying Cry
BCH may soon attempt a strong bullish recovery.
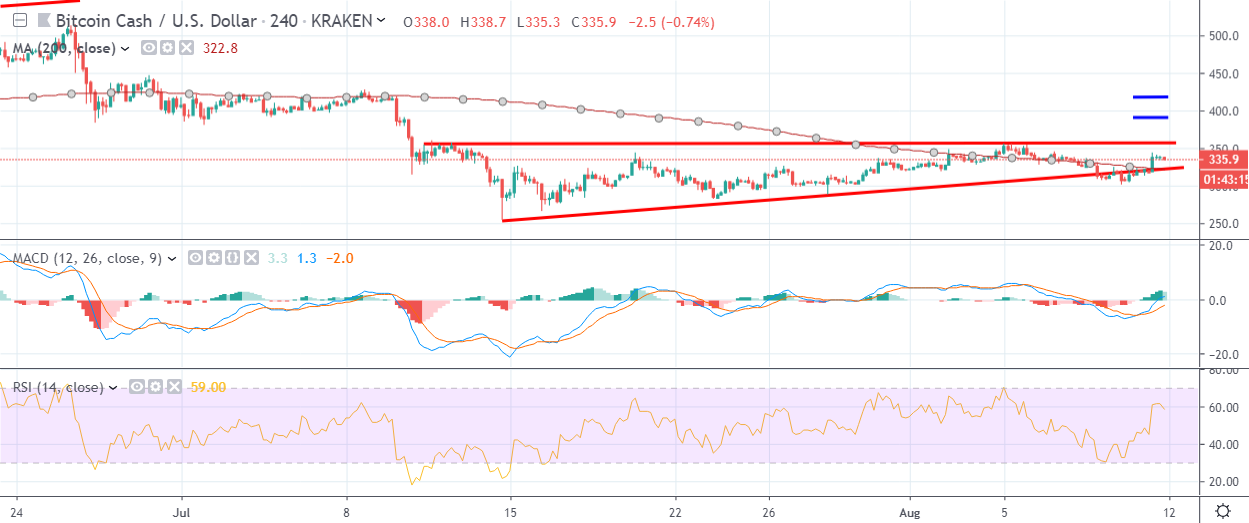
- Bitcoin Cash has a bullish short-term bias, with the BCH / USD pair recovering above its 200-period moving average on the four-hour time frame
- The four-hour time frame shows the presence of a bullish ascending triangle pattern
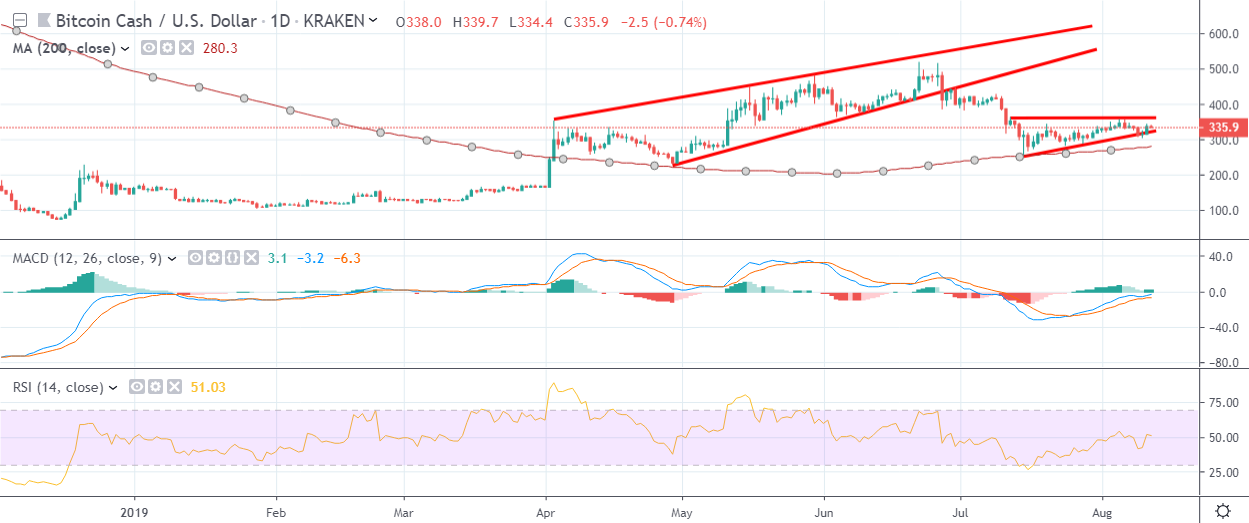
- The daily time frame highlights that the BCH / USD pair is still trading above its key 200-day moving average
Bitcoin Cash / USD Short-term price analysis
Bitcoin Cash has a bullish short-term trading bias, with the BCH / USD pair recovering above its 200-period moving average on the four-hour time frame.
The four-hour time frame shows that a bullish ascending triangle pattern has formed. The mentioned time frame also shows that the BCH / USD pair is starting to post bullish lower lows.
Key upside resistance for the BCH / USD pair is located at the $380.00 and $420.00 levels.
Technical indicators on the four-hour time frame are bullish and continue to issue buy signals.
Pattern Watch
Traders should note that ascending triangles are typically considered to be bullish patterns.
Relative Strength Index
The RSI indicator on the four-hour time is bullish, although it is approaching overbought territory.
MACD Indicator
The MACD indicator on the four-hour time frame remains bullish, with the MACD signal line and histogram both issuing buy signals.
Bitcoin Cash / USD Medium-term price analysis
Bitcoin Cash has a bullish medium-term trading outlook, with the BCH / USD pair attempting to bounce from its key 200-day moving average.
The daily time frame is showing that the BCH / USD pair is consolidating inside an ascending triangle pattern. A stronger bullish correction may occur now that downside momentum is starting to stall.
Technical indicators across the daily time frame are now starting to turn bullish.
Pattern Watch
Traders should note that a bearish head and shoulders pattern can also be seen on the daily time frame.
Relative Strength Index
The RSI indicator on the daily time frame is rising and is starting to edge above neutral territory.
MACD Indicator
The MACD indicator on the daily time frame has turned bullish and is now starting to issue a buy signal.
Conclusion
Bitcoin Cash may attempt to stage a bullish technical correction in the short-term now that downside momentum is starting to fade.
The ascending triangle patterns seen across both time frame suggest that a potential rally in the BCH / USD pair could extend towards at least the $380.00 level.
Check out our coin guide for Bitcoin Cash.