Bitcoin Cash and SV to Go Through First Halving; Here’s the Price Implications
The biggest Bitcoin hard forks by market capitalization are scheduled to go through a fixed process known as the halving, which could have serious price implications.
The two biggest Bitcoin hard forks, Bitcoin Cash (BCH) and Bitcoin SV (BSV), are set to experience a significant reduction in their overall rate of token issuance. As speculation mounts around these two events, technical patterns estimate that a retracement could be underway.
BCH and BSV: Rewards Reduction Events
Bitcoin Cash and Bitcoin SV are about to go through a fixed process known as the halving, which affects the reward miners receive for mining tokens in a blockchain-based network.
This event impacts the inflation rate as the reduction in future supply increases.
In the next few hours, miners who are currently being awarded 12.5 new BCH for every block they mine will only be rewarded with 6.25 BCH per block. Meanwhile, those who are mining BSV can expect a similar block rewards reduction sometime tomorrow.
Since this will be the first time that both of these altcoins go through a halving, the price implications are unknown.
Nevertheless, the past block rewards reduction events that Bitcoin has gone through have demonstrated to be the catalyst for a significant bullish impulse.
Following the 2012 halving, for instance, the flagship cryptocurrency skyrocketed over 97x to peak at a high of nearly $1,200 a year later. Similarly, after its second block rewards reduction event in mid-2016 BTC entered a parabolic advance that saw its price increase by 30x.
The bellwether cryptocurrency surged to an all-time high of roughly $20,000 in late 2017.
Bitcoin’s deflationary monetary policy has certainly allowed its value to enhance significantly over the years as it becomes more scarce.
This core economic model is also embedded in Bitcoin Cash and Bitcoin SV’s protocol, which raises the question of whether or not a similar price action can be expected for these cryptocurrencies too.
A Correction Is in the Works
From a technical perspective, it is nearly impossible to estimate what the long-term future holds for BCH and BSV. However, multiple patterns and indexes can help determine where these altcoins could be headed in the following days after their respective halvings occur.
The TD sequential indicator is currently presenting a sell signal in the form of a green nine candlestick on Bitcoin Cash’s 1-day chart. This bearish formation forecasts a one to four candlesticks correction or the beginning of a new downward countdown. If validated, BCH could drop to retest the support provided by the 78.6% Fibonacci retracement level that sits around $168 before continuing its uptrend.
A red two candlestick trading below a preceding red one candlestick and a daily candlestick close underneath the 61.8% Fibonacci retracement level could serve as confirmation of the bearish signal presented by the TD sequential indicator.
Conversely, breaking above the 50% Fibonacci retracement level could jeopardize the pessimistic outlook and may lead to a further upward advance.
Along the same lines, Bitcoin SV could face the same fate as Bitcoin Cash since the TD sequential indicator is also presenting a sell signal in its daily chart. An increase in the selling pressure behind BSV may confirm the bearish outlook presented by this technical index.
If this were to happen, Craig Wright’s cryptocurrency could drop to the lower boundary of a parallel channel where it has been contained since 2018. This support barrier is currently hovering around $100.
Nonetheless, a sudden spike in demand that allows BSV to close above $250 could trigger a state of FOMO (fear-of-missing-out) among investors. If this happens, then the price of this crypto could surge to the top of the channel at $430.
Overall Sentiment for Bitcoin Cash and BSV
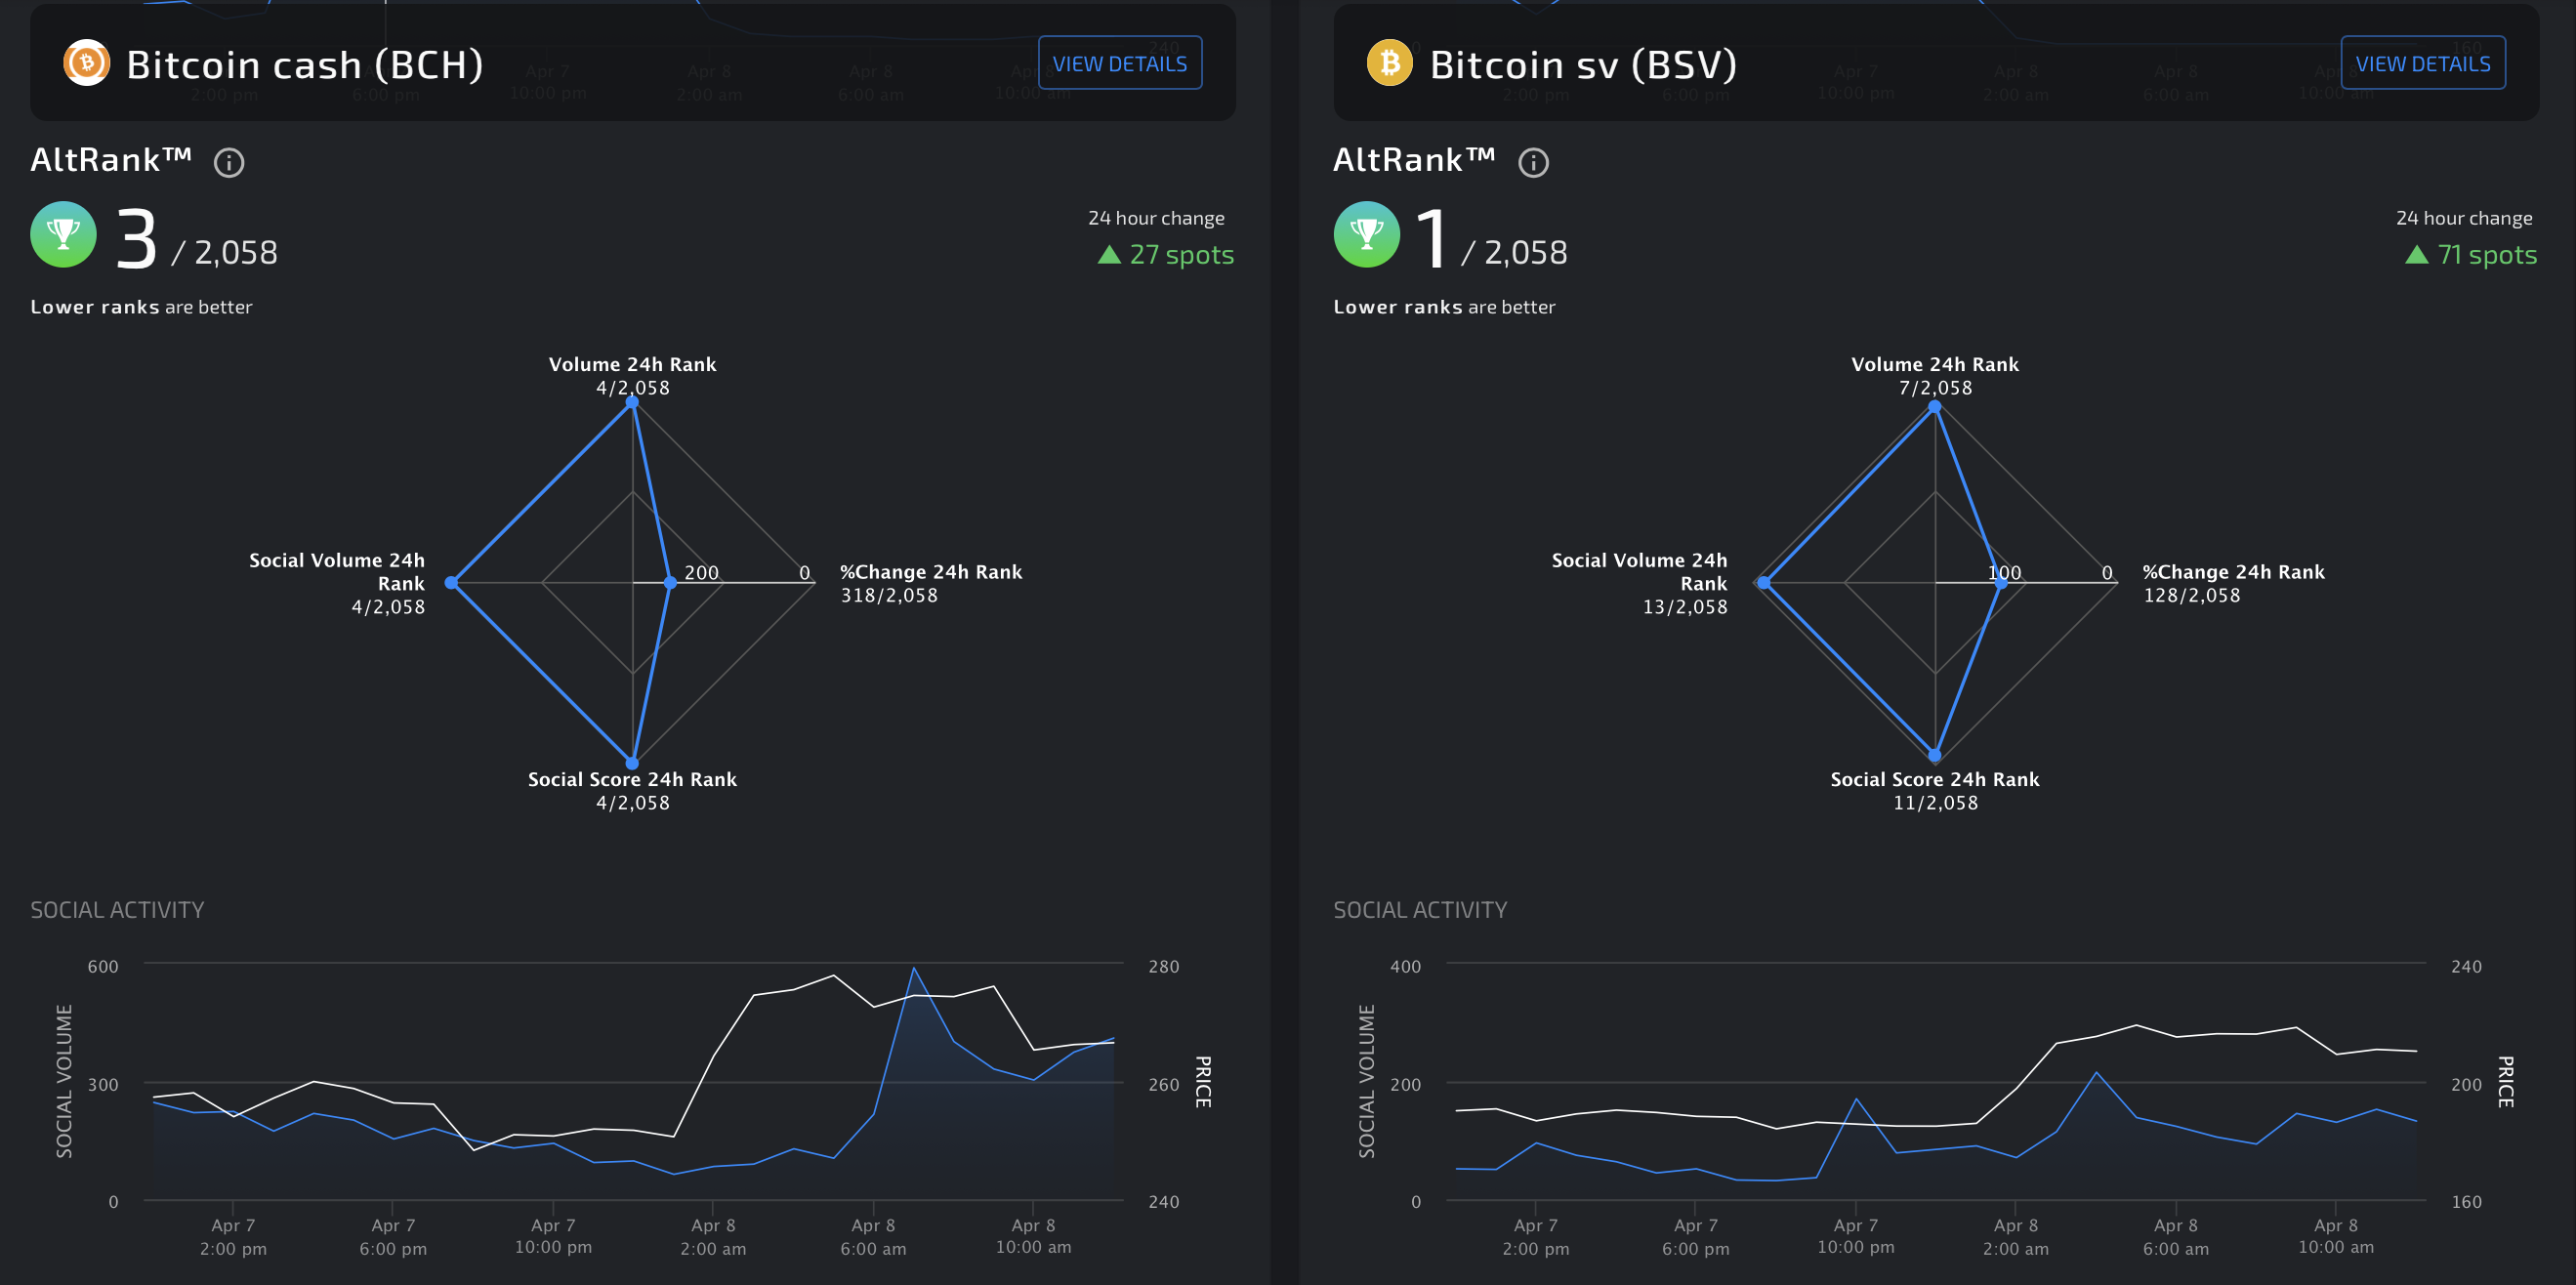
Bitcoin Cash and Bitcoin SV’s social engagement metrics have exploded over the past few hours, according to LunarCRUSH.
The crypto community sentiment provider takes into consideration interactions across all social posts—including favorites, likes, comments, replies, and other metrics—to determine how engaged a community is around a particular digital asset.
Based on these data sets, the California-based firm reported that BCH, as well as BSV, have been experiencing massive spikes of over 800,000 engagements per hour. Roughly 70% of those social interactions across multiple platforms have been bullish about these two altcoins.
The bullish sentiment, as well as the recent price action, have allowed Bitcoin Cash to occupy the third spot in LunarCRUSH’s “AltRank” while Bitcoin SV leads the rankings.

Additionally, data from Santiment reveals that the number of new addresses being created on a daily basis on both BCH and BSV’s network is surging.
According to Brian Quinlivan, Market and Social Media Director at Santiment, a rising network growth usually leads to a price increase over time.
Although Quinlivan affirms that network growth is “one of the most accurate foreshadowers,” only time will tell whether Bitcoin Cash and Bitcoin SV are poised for a retracement or a further bullish advance.
