Shutterstock photo by KieferPix
Bitcoin, Ethereum May Recover With Strong Support
Strong hands are accumulating BTC and ETH at every downswing, suggesting further price gains.
Bitcoin and Ethereum began this week’s trading session on a negative note as each coin’s price dropped by more than 11%. Despite the losses incurred, the technicals suggest that these cryptocurrencies are primed to recover and aim higher.
Bitcoin Uptrend Remains Intact
Bitcoin made headlines over the weekend as it surged to a new all-time high of $61,950 on Mar. 13.
While the upswing was anticipated by the breakout from an inverse head-and-shoulders pattern formed on BTC’s 4-hour chart, the Tom Demark (TD) Sequential indicator forecasted a steep decline.
The technical index presented a sell signal in the form of a green nine candlestick after Bitcoin surpassed the $60,000 mark. A spike in downward pressure helped validate the bearish formation, leading to an 11.50% retracement on Bitcoin’s price chart.

Although BTC dropped to a low of $54,600, it quickly bounced off this level to regain $56,000 as support. Such market behavior suggests that high net-worth individuals and institutions took advantage of the downswing to add more tokens to their portfolios.
Just as Norway-based industrial investment giant Aker ASA and Chinese beauty app Meitu announced the purchase of $58 million and $18 million during early March’s correction, similar announcements could come out of the most recent dip.
On-chain analyst Willy Woo maintains that “there is a very strong case” that Bitcoin will not move below $50,000 again. Roughly 6% of the circulating supply was bought above the $1 trillion market capitalization, adding credence to the bullish thesis.
“With the strong buying we’ve seen [these] last 3 weeks, we’ve formed a very strong support band. 16% of the available coin supply moved to new wallets inside this $46k-$58k price range giving these price levels immense validity in the price discovery mechanism,” Woo explained in his most recent Substack newsletter.

As long as Bitcoin continues to hold above the TD’s setup support trendline at $56,000, the odds will continue to favor the bulls. Bouncing off this demand barrier could see BTC target $63,000 as the next significant area of resistance.
Although it is too early to tell, there is a high probability that if the $63,000 resistance breaks, Bitcoin will aim for $74,000.
On the flip side, investors must pay close attention to a 4-hour candlestick close below $56,000, as this has the potential to invalidate the bullish outlook. By slicing through this support level, Bitcoin will signal the beginning of a more significant correction to $52,000 before the uptrend resumes.
Ethereum Sits on Top of Stable Support
Like Bitcoin, Ethereum recently rose to $1,950 to reach the target presented by a symmetrical triangle pattern that developed on its 4-hour chart. Investors seem to have taken advantage of the rising price action to book profits.
The sudden spike in selling pressure saw Ethereum take an 11.30% nosedive to hit a low of $1,730, at which point prices eventually rebounded. Transaction history shows that this is a strong support level that may keep the uptrend in tact if it continues to hold.

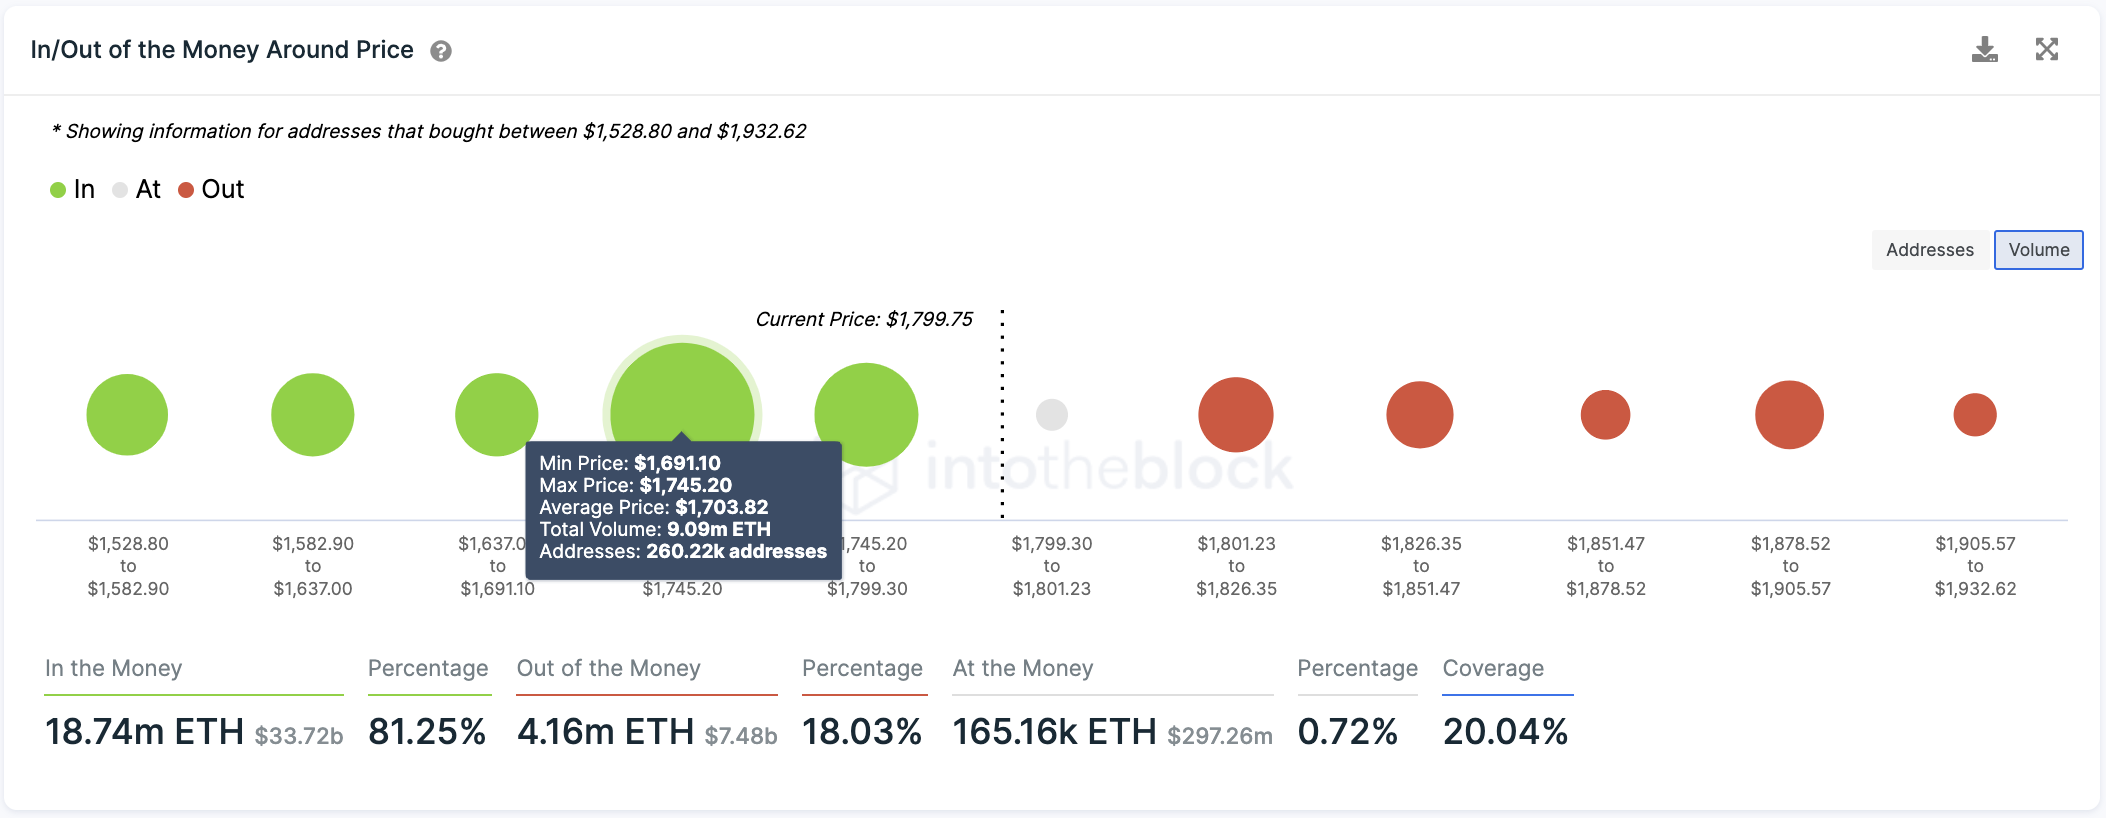
IntoTheBlock’s In/Out of the Money Around Price (IOMAP) model reveals that the $1,700 level represents a massive demand barrier that will not be easy to break. Over 260,000 addresses previously purchased more than 9 million ETH between this price zone.
Further price deprecation may prove challenging since holders within this price range will likely do anything to keep their positions “In the Money.” Investors may even buy more tokens in the event of another downswing to allow Ether to rebound.

Due to the lack of resistance ahead, it is reasonable to assume that Ethereum could bounce off the $1,700 support to retest the recent high of $1,950. If buying pressure is significant enough for Ether to close above this resistance barrier, then the odds will drastically increase for prices to advance towards a new all-time high of $2,500.
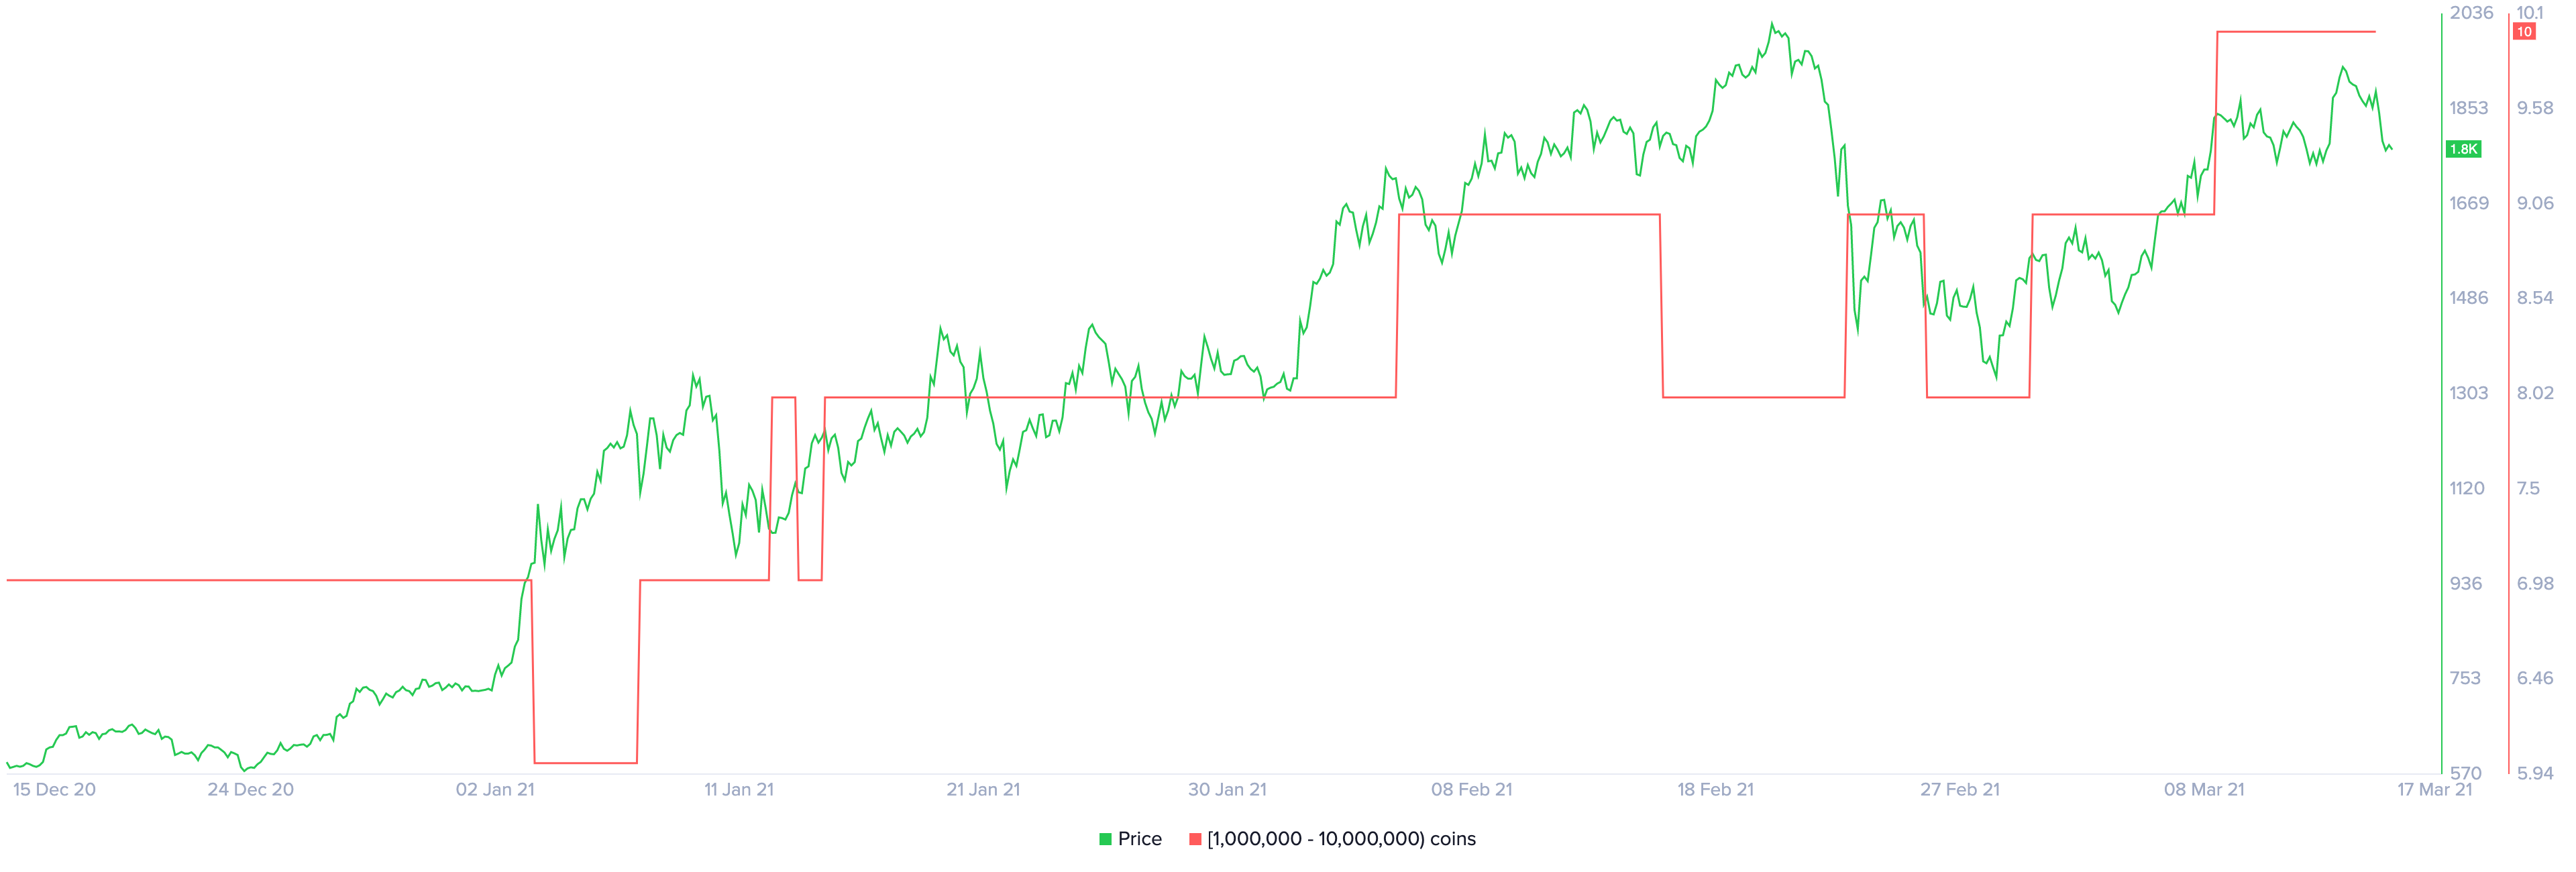
When looking at Ethereum’s holder distribution, the bullish thesis holds. Data from Santiment shows that over the past month, the upward pressure behind Ethereum rose dramatically. Roughly two new addresses holding 1,000,000 to 10,000,000 ETH joined the network, representing a 25% increase in such a short period.
At first glance, the recent increase in the number of large investors behind Ether may seem insignificant. However, when considering that these whales hold between $1.7 billion and $17 billion in Ether, that new buying pressure can translate into billions of dollars.

Regardless, a 4-hour candlestick close below the $1,700 support could signal the beginning of a steep correction. If this were to happen, Ether might dive towards the next crucial area of support, around $1,350, based on the IOMAP cohorts.
Disclosure: At the time of writing, this author owned Bitcoin and Ethereum.
