
Bitcoin and Ethereum Show Signs of Recovery Despite Recent Correction
Different technical patterns suggest that the top two largest cryptocurrency by market capitalization are bound for a bullish impulse.
Bitcoin and Ethereum incurred significant losses over the past few days, dropping to crucial support levels. While market participants continue to put out fires due to the recent downturn, different technical metrics suggest everything’s not lost.
Bitcoin Seems Poised to Rebound
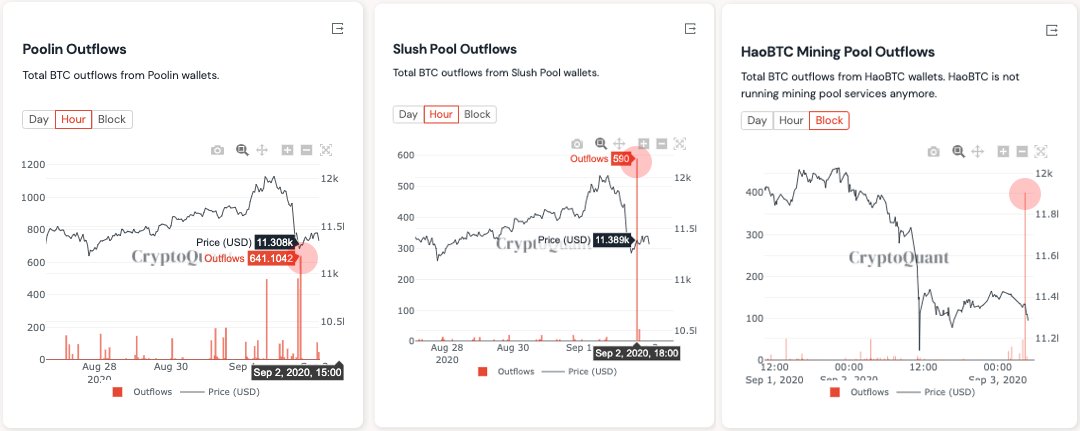
On Sept. 2, on-chain data analytics provider CryptoQuant registered a significant spike in the number of Bitcoin being transferred to different cryptocurrency exchanges.
The company affirmed that the large exchange deposits originated from addresses related to various mining pools, including Pooling, Slush, and HaoBTC.
The sudden spike in the number of BTC moved to exchanges was quite unusual, and it suggested that these mining companies were preparing to sell their tokens, according to CryptoQuant.
Indeed, an essential number of sell orders were placed across different exchanges after the flagship cryptocurrency was rejected from the $12,000 resistance level. The rising selling pressure led to a 19% correction that saw Bitcoin drop below the $10,000 support level.
BTC went as low as $9,813, which is the lowest price point it has been since late June.
The downswing allowed Bitcoin to retest the multi-year trendline that was previously acting as resistance and rejecting any upward price action since late December 2017. Given the strength that this trendline showed over the last three years, it is reasonable to assume that it will now serve as strong support.
Bouncing off this crucial hurdle can be seen as an extremely bullish sign that may help the uptrend to continue.
The TD sequential indicator adds credence to an optimistic outlook. This technical index is currently presenting a buy signal in the form of a red nine candlestick on BTC’s 12-hour chart. The bullish formation suggests that the bellwether cryptocurrency is bound for a one to four 12-hour candlestick upswing or the beginning of a new upward countdown.
Based on historical data, the TD index has been incredibly accurate at predicting Bitcoin’s local tops and bottoms. It even presented a sell signal on Aug. 31, just before prices dropped nearly 19%.
For this reason, the current forecast must be taken seriously despite the high levels of skepticism in the cryptocurrency market.
In the event of an upswing, IntoTheBlock’s “In/Out of the Money Around Price” (IOMAP) model suggests that Bitcoin could face stiff resistance between $11,500 and $11,800.
Based on this on-chain metric, approximately 2 million addresses bought over 1.2 million BTC around this price level.
Such a massive supply wall could absorb some of the buying pressure. Holders within this price range will likely try to break even in their long positions. But if demand for the pioneer cryptocurrency is significant enough, it may slice through this resistance barrier and take another aim at the $12,000 hurdle.
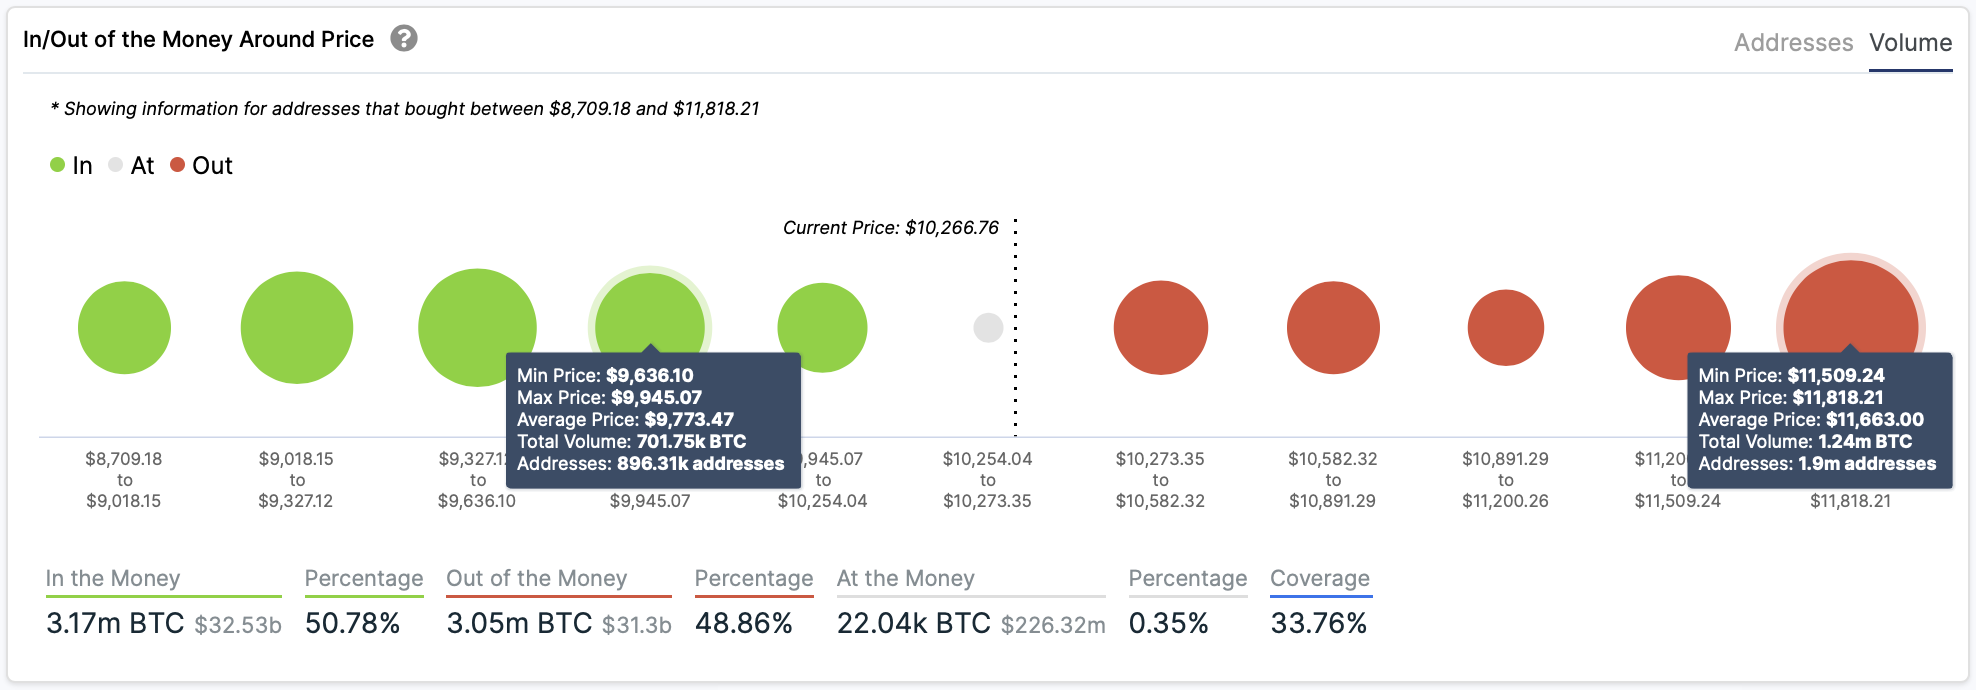
On the flip side, the IOMAP cohorts reveal that one of the most significant support levels underneath Bitcoin lies between $9,640 and $9,950. Here, nearly 900,000 addresses are holding over 700,000 BTC.
As long as prices remain trading above this level, the bullish outlook will prevail. Otherwise, the flagship cryptocurrency could plummet towards $9,000.
Ethereum Faces Stiff Resistance Ahead
When looking at Ethereum from a high time frame, such as its 3-day chart, the price action of the past two years created a double bottom pattern. This technical formation suggests that Ether’s trend changed from bearish to bullish the moment it broke above late June 2019’s high of $360.
Based on the “W” pattern, ETH is on its way up to $800 or higher.
Regardless, the recent correction seen across most digital assets within the cryptocurrency market also affected the smart contracts giant.
As roughly $40 billion were erased from the total crypto market capitalization, Ethereum took a 37% nosedive. The downswing allowed it to test the neckline of the W pattern previously mentioned.
Usually, assets tend to retrace to this support level when they form a double bottom pattern. Therefore, the recent pullback could help maintain Ether’s uptrend healthy. If Ethereum can rebound from this hurdle that sits between $340 and $300, it would likely continue surging towards $800.
Large investors seem to be aware of the high probability of a further advance.
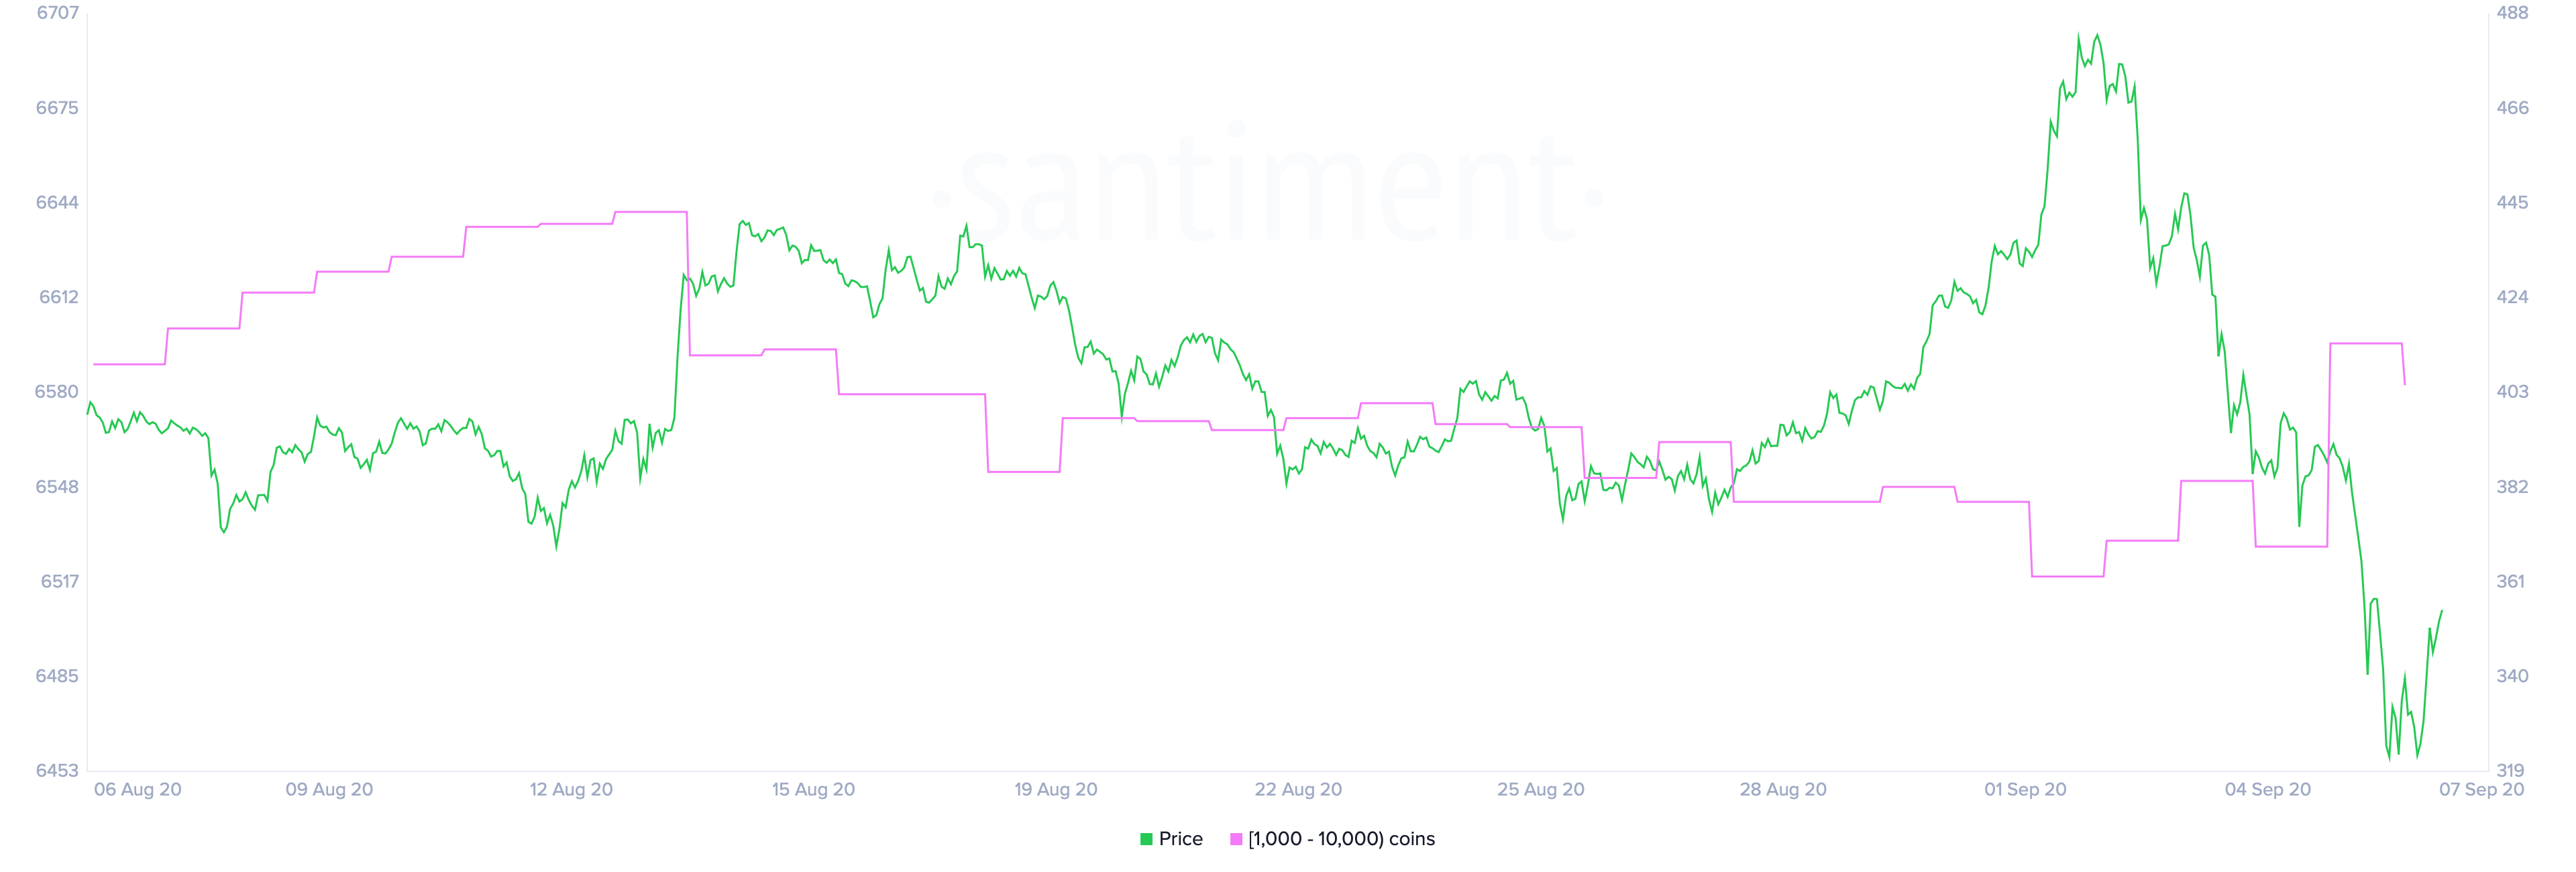
Santiment’s holder distribution chart shows that as prices were falling, there was a significant spike in the number of addresses with millions of dollars in Ether, colloquially known as “whales.”
The behavioral analytics firm recorded a 1% jump in the number of addresses holding 1,000 to 10,000 ETH. Roughly 68 new whales have joined the network in the past three days.
Such an increase in the number of large investors behind Etherum may seem insignificant at first glance. But when considering these whales hold between $350,000 and $3.5 million in Ether, the sudden spike in buying pressure can translate into millions of dollars.
If the buying spree continues, ETH may have the ability to rebound and reach the target presented by the double bottom pattern.
Nonetheless, IntoTheBlock’s IOMAP model suggests that the bulls may have a difficult time pushing prices up.
Based on this fundamental indicator, around 1 million addresses bought nearly 8 million ETH between $388 and $398. This massive supply barrier must be turned into support to add credence to the bullish outlook. Until then, Ethereum could pull back and retest the recent lows.
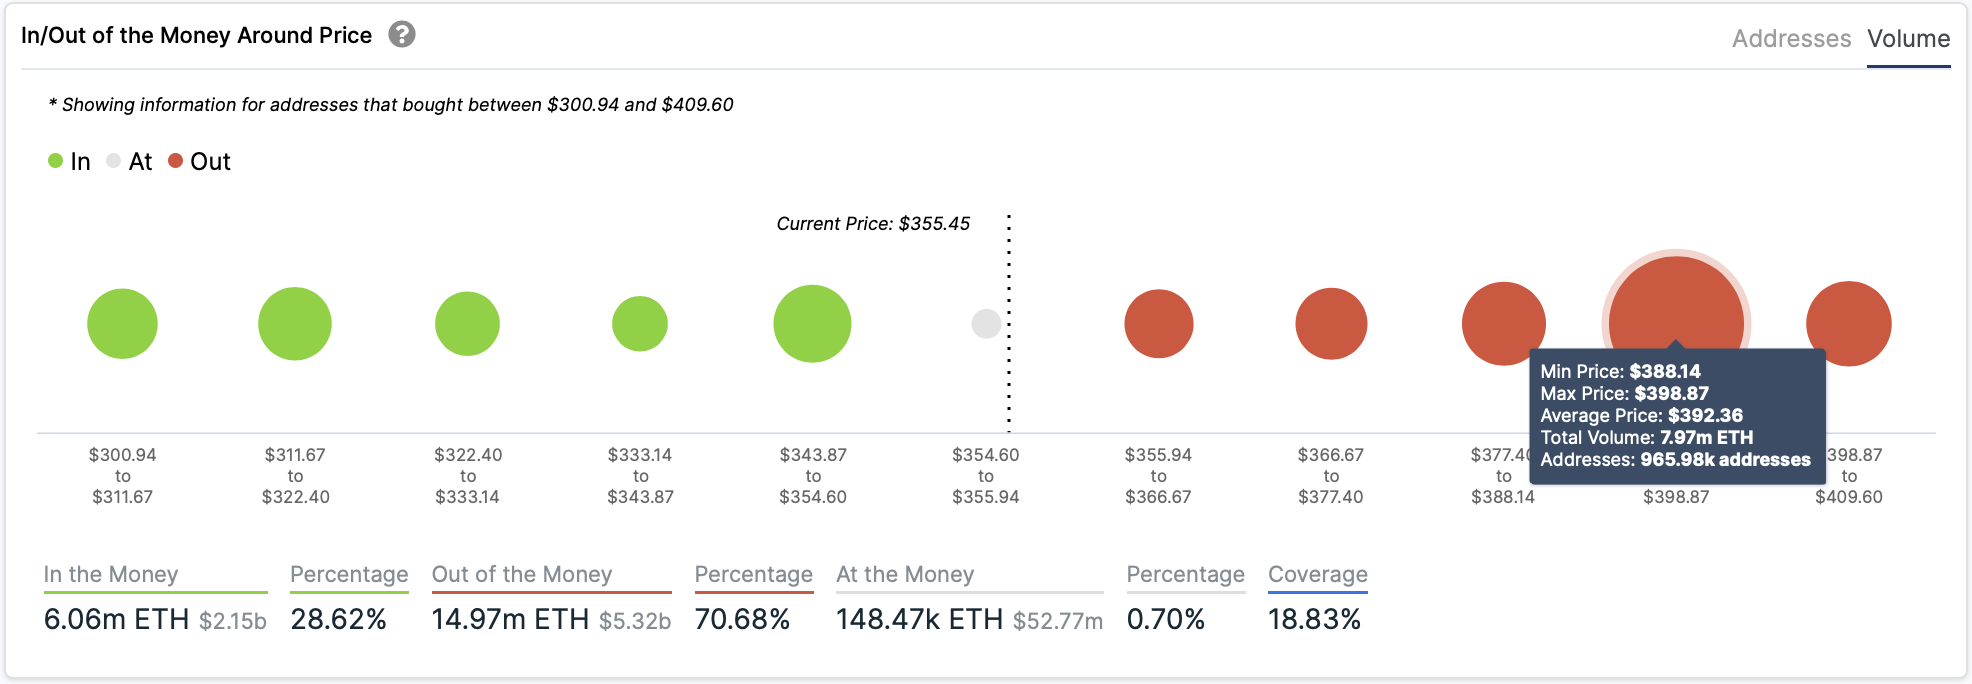
It is worth noting that there isn’t any significant support wall underneath Ehtereum based on the IOMAP cohorts.
Thus, another spike in selling pressure that sends the digital asset below $300 may have the strength to invalidate the bullish outlook. Under such circumstances, ETH could fall to $260.
Weak Hands Get Flushed Out
The recent downswing seen across the entire cryptocurrency market wiped out a significant number of overleveraged traders. Data reveals that more than $2.3 billion worth of leveraged positions were liquidated in the past four days.
The massive sum of reported losses sent investors into fear for the first time in the last two months, according to the Crypto Fear and Greed Index (CGIF).
Fear, however, can be perceived as a positive sign. The last time the CFGI was this low the total cryptocurrency market capitalization surged over 37%. Now, a dose of patience could help determine whether a similar scenario could be about to take place.