Bitcoin, Ethereum, XRP Prepare for Explosive Price Movement
It's the calm before the storm. The top three cryptocurrencies by market capitalization are taking a breather before explosive price movement.
Bitcoin, Ethereum, and XRP prices are falling behind while small-cap altcoins see preposterous levels of growth not seen since 2017. Indicators point to impending volatility, and the impact on prices will be explosive.
Bitcoin Camps on Hefty Support Level
Bitcoin prices bounced within an ascending channel since the beginning of the month. The upper and lower boundaries of this technical formation prevented movement outside of these price levels.
Overhead resistance rejected an advance in mid-August. BTC responded by correcting to the lower support level. Given the price history of the last month, it is reasonable to assume that Bitcoin will once again rebound from the lower support boundary.
If combined with a spike in buying pressure, BTC prices could reach $12,250, or even a new yearly high of $12,800.
The TD sequential indicator adds credence to Bitcoin’s optimistic outlook. This technical index recently presented a buy signal on BTC’s 12-hour chart. The bullish formation developed as a red nine candlestick, estimating a one to four 12-hour candlesticks upswing or the beginning of a new upward countdown.
In the event of a bullish impulse, IntoTheBlock’s “In/Out of the Money Around Price” (IOMAP) model reveals there is a crucial resistance level ahead of Bitcoin that could hold surging prices at bay. Based on this on-chain metric, roughly 800,000 addresses had previously purchased nearly 440,000 BTC between $11,800 and $12,150.
Such a significant supply barrier may have the ability to absorb some of the buying pressure. If prices advance to this level, holders who have been underwater may try to break even on their positions, preventing prices from climbing further.
Slicing through this hurdle, however, might see the bellwether cryptocurrency aim for the upper boundary of the ascending parallel channel mentioned earlier. Bitcoin could see wild gains given that resistance beyond $12,150 is sparse, at least according to IOMAP data.
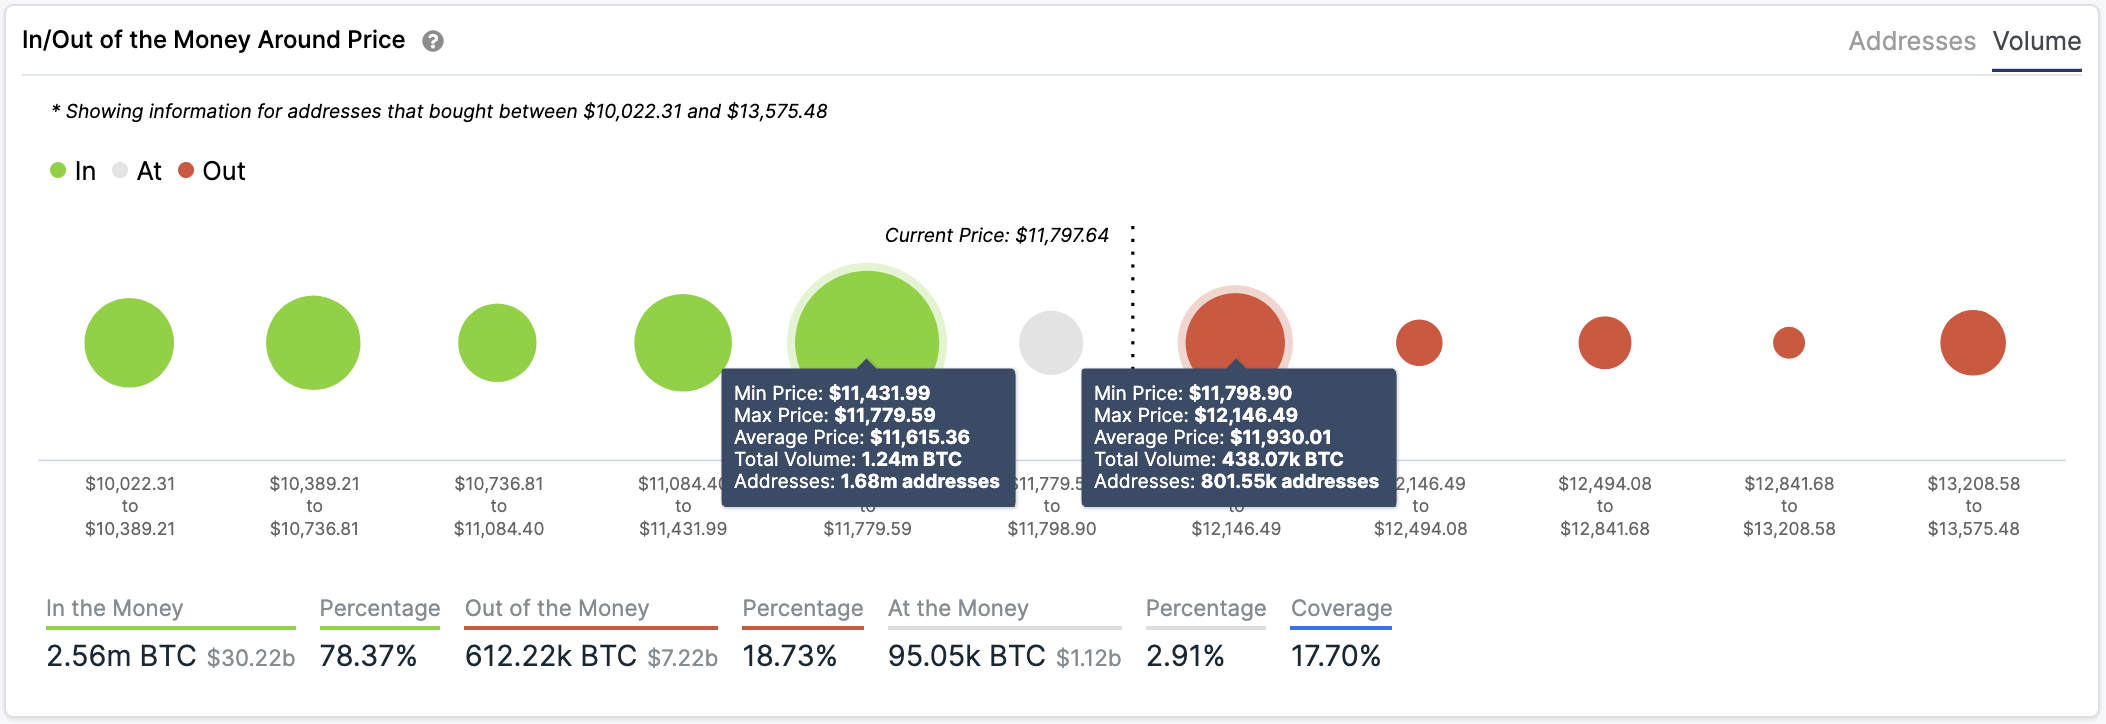
On the flip side, the IOMAP cohorts show that Bitcoin sits on top of stable support. Nearly 1.7 million addresses are holding roughly 1.3 million BTC between $11,430 and $11,780. This crucial area of interest suggests that bears will struggle to push prices down. Right now, the odds favor the bulls.
Ethereum Presents Ambiguous Outlook
Ethereum seems to have formed a double bottom pattern on the larger time frames, such as its 3-day chart. This charting pattern indicates that Ether’s trend changed from bearish to bullish from a macro perspegctive. This optimistic view was confirmed the moment prices cut through the $340 resistance level. Now, the W pattern forecasts that ETH will continue to rise towards $800 or higher.
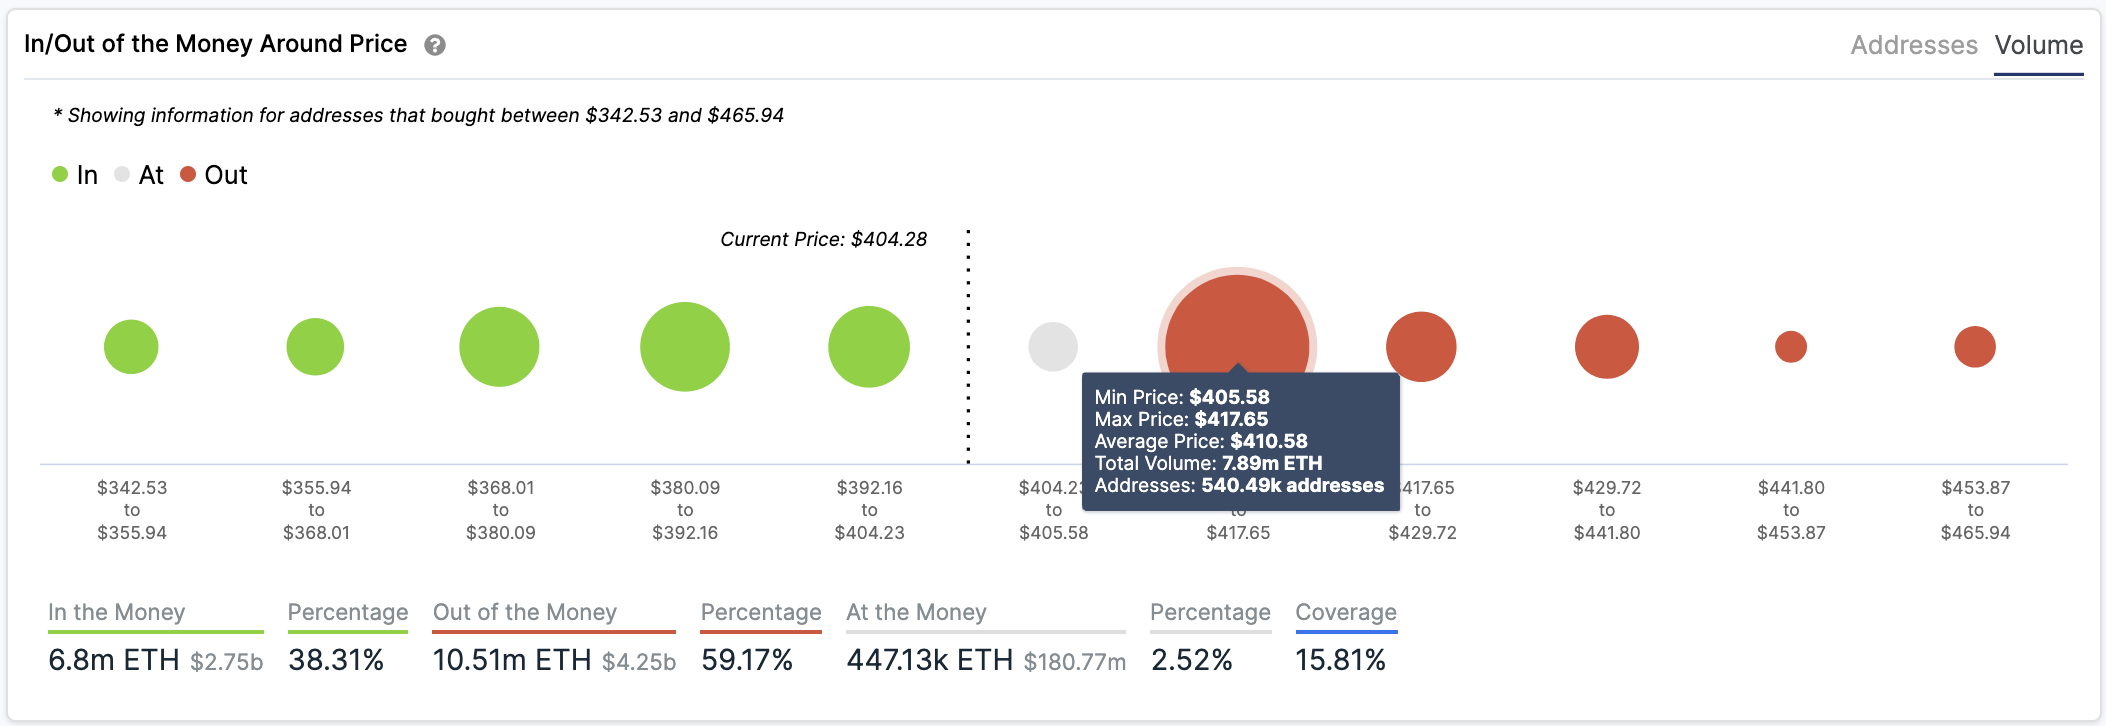
Nonetheless, IntoTheBlock’s IOMAP reveals that the smart contracts giant faces strong resistance ahead. Based on this fundamental indicator, over 540,000 addresses bought 7.9 million ETH between $406 and $418. As such, further price appreciation may prove challenging.
The formidable supply wall ahead of Ethereum could even trigger a correction if prices rebound sharply enough. Ethereum needs time to achieve its upside potential, both on-chain and for ETH 2.0. Bad news on either front could erase this year’s hard-earned gains.
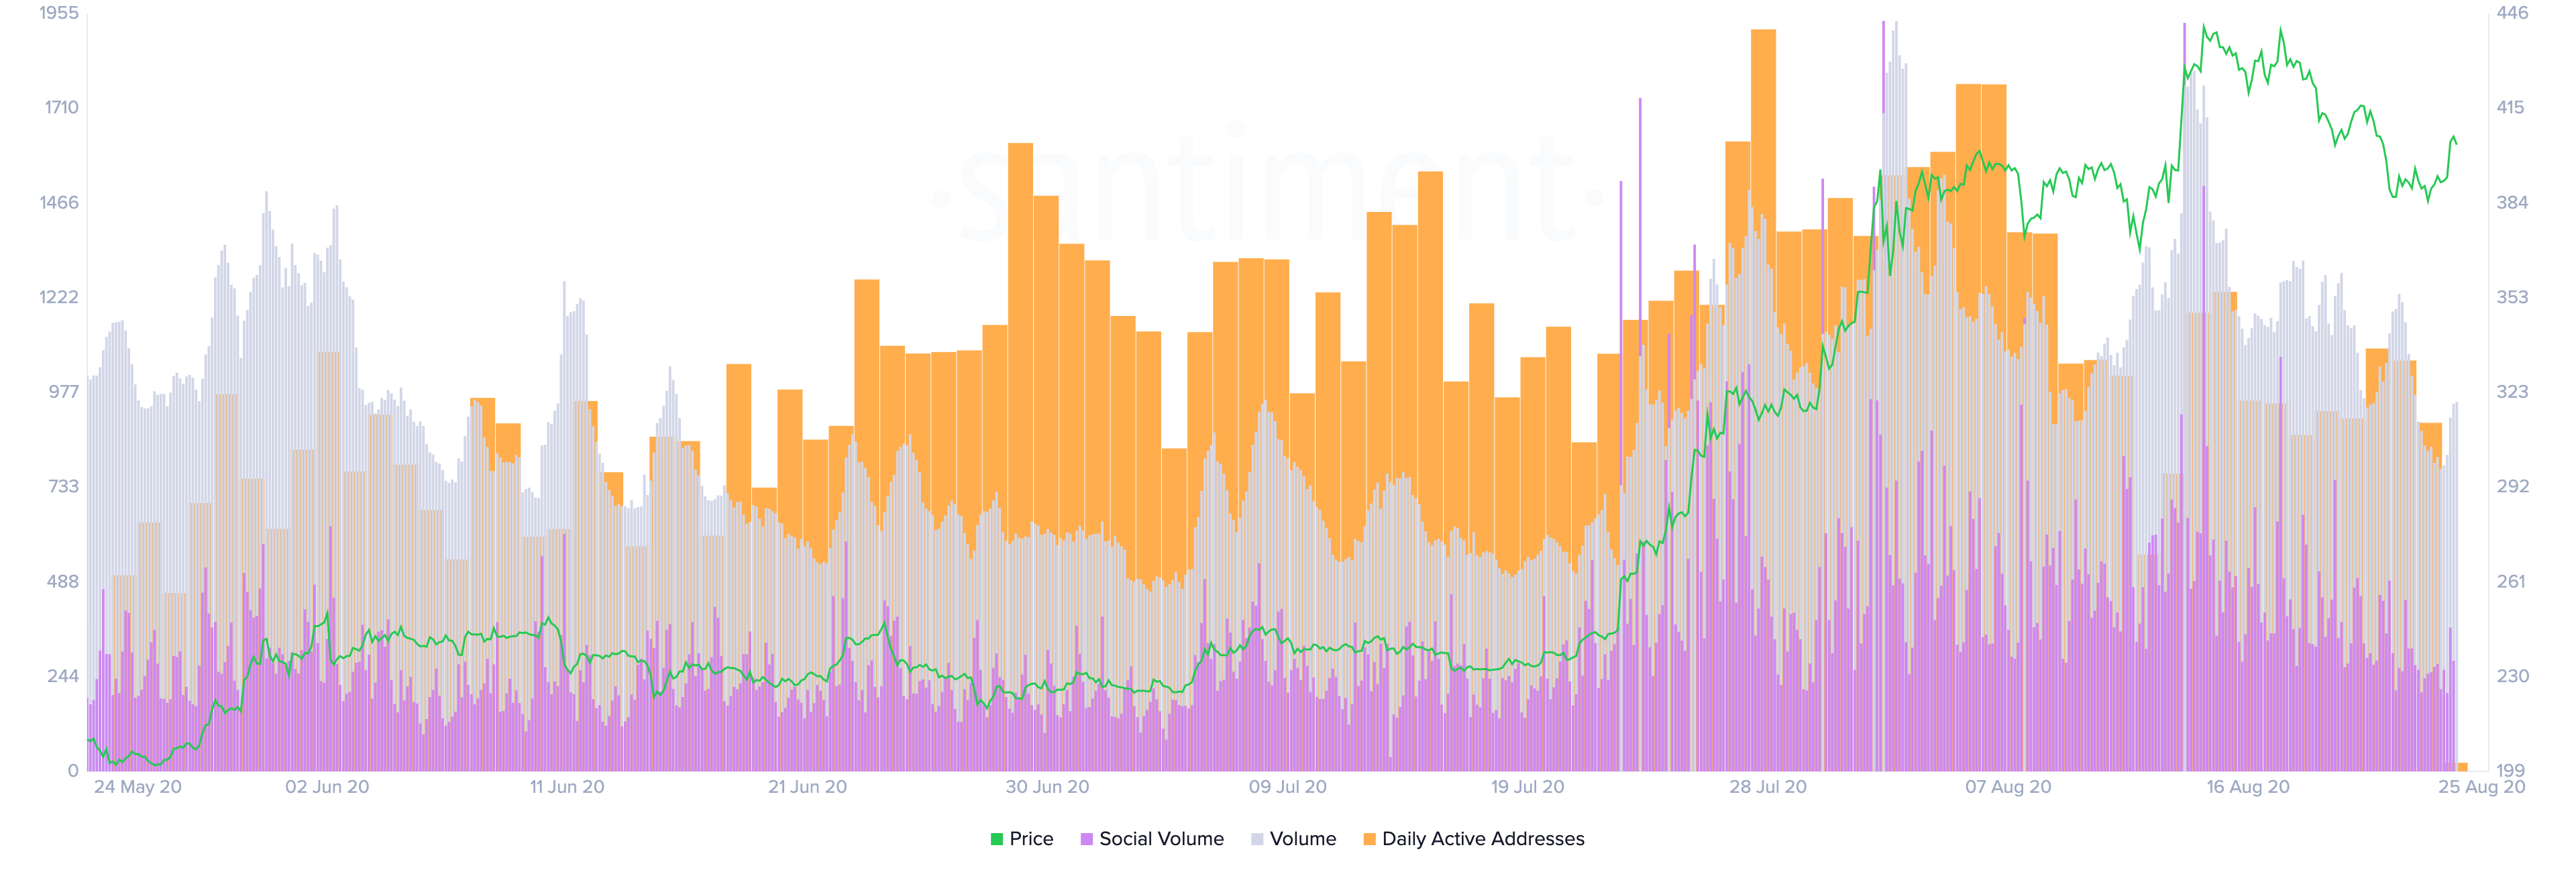
ETH’s on-chain volume, daily active addresses, and social volume have been steadily declining since early August. According to data analytics firm Santiment, these fundamental metrics help determine whether a coin is poised for a further advance.
Santiment maintains that when these three indexes drop in unison, then they form a reliable sign for future downward price action.
Nonetheless, the unexpected exuberance about micro-cap altcoins shows that the bullish outlook can’t be ignored. Breaking above overhead resistance in the chart shown earlier would likely lead to new yearly highs given the lack of subsequent supply barriers.
XRP Prepares for Its Next Big Move
Since the beginning of August, Ripple’s XRP entered a consolidation phase, staying within a narrow trading range between $0.28 and $0.32. Low volatility caused another indicator, XRP’s Bollinger bands, to squeeze on the 1-day chart. Squeezes are usually followed by notable price movements; The longer the squeeze the more violent the breakout.
Since this technical index does not provide a clear path about the direction of XRP’s trend, the area between the lower and upper band is a reasonable no-trade zone. Only a candlestick close above or below any of these crucial hurdles can determine where this altcoin is headed next.
Moving past the overhead resistance would likely encourage market participants to buy more XRP. If this were to happen, the increase in buy orders might have the strength to push prices towards the 127.2% Fibonacci retracement level around $0.39.
However, traders must be cautious. To validate the optimistic outlook the $0.28 support level must hold. If the support fails, XRP could drop towards the 61.8% or 50% Fibonacci retracement level. These support barriers are at $0.24 and $0.22, respectively.
The Crypto Market Moves Forward
Lackluster price action among the Bitcoin, Ethereum, and XRP show that a steep correction may need to materialize before the uptrend resumes. Combined with solid fundamentals, such a correction could help support the health of the long-term uptrend.
That said, the impressive price rallies of different altcoins, such as OMG Network and Aave, call that hypothesis into question. Extreme greed reigns over the market right now, which is not a positive sign for prices.
Given the global economic landscape, it is crucial to pay close attention to the bearish signs developing around the cryptocurrency market. Without a sound risk management strategy, a trader’s hard-fought gains could evaporate overnight.