Cosmos Token Moons 50%, But Near-Term Technicals Spell Trouble for ATOM
ATOM has been trending upwards over the past few days while different on-chain metrics show that prices may retrace soon.
The interoperable blockchain network Cosmos has been on a roll lately as its native token, ATOM, rose to new all-time highs. Regardless, different metrics suggest that this cryptocurrency is poised to retrace before continuing its uptrend.
Cosmos’ ATOM Rises to New All-Time Highs
Cosmos captured the market’s attention over the weekend following an impressive upswing that saw its token hit a new all-time high.
ATOM’s price appreciated over 50% in the past three days, outperforming some of the top cryptocurrencies by market capitalization. It went from hovering around $5.60 to reach $8.6, for the first time.
Alongside prices, data reveals that the number of ATOM-related mentions on different social media networks has also exploded. Since Aug. 21, this altcoin’s social engagement rose over 5x. The rising chatter around Cosmos allowed it to move to the number one spot on Santiment’s Emerging Trends list.
The high levels of notoriety that the interoperable blockchain token has generated is not necessarily a good sign for its short-term price action. When prices pump, and the crowd pays increased attention, a token usually drops shortly after.
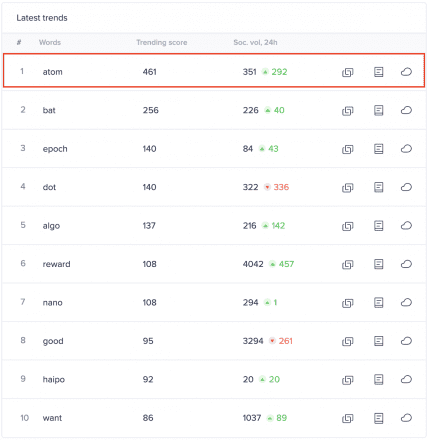
Dino Ibisbegovic, head of content and SEO at Santiment, maintains that after any given cryptocurrency claims one of the top three positions on this list, prices regularly fall by roughly 8%.
Thus, increased crowd attention can be considered a leading indicator of price slumps.
A Steep Correction Before Further Gains
The TD sequential index adds credence to the bearish outlook. This technical indicator is currently presenting a sell signal in the form of a green nine candlestick on Cosmos’ 12-hour chart.
A spike in sell orders may help validate the bearish formation, suggesting a one to four 12-hour candlesticks correction before the uptrend resumes.
Historical data shows that TD setup has been incredibly accurate at anticipating local tops on this altcoin’s trend. When looking at the 12-hour chart, roughly six of the eight sell signals presented since the beginning of the year were validated. Therefore, the current pessimistic view must be taken into consideration despite the ongoing hype around ATOM.
A downswing that sends Cosmos below the $7.8 support level will help confirm the bearish scenario. Under such circumstances, ATOM may drop towards the 61.8% or 50% Fibonacci retracement level.
These crucial areas of support sit at $7.1 and $6.6, respectively.
Given the recent volatility levels that other cryptocurrencies such as OMG Network have experienced, the optimistic outlook cannot be taken out of the question. A bullish impulse that pushes ATOM above the recent high of $8.6 may have the strength to allow prices to advance further.
If this were to happen, investors must watch out for an upswing towards the 127.2% Fibonacci retracement level that sits at $9.7.