
Bitcoin Price Analysis BTC / USD: What Goes Up….
BTC is correcting quite heavily, but that's healthy behavior.
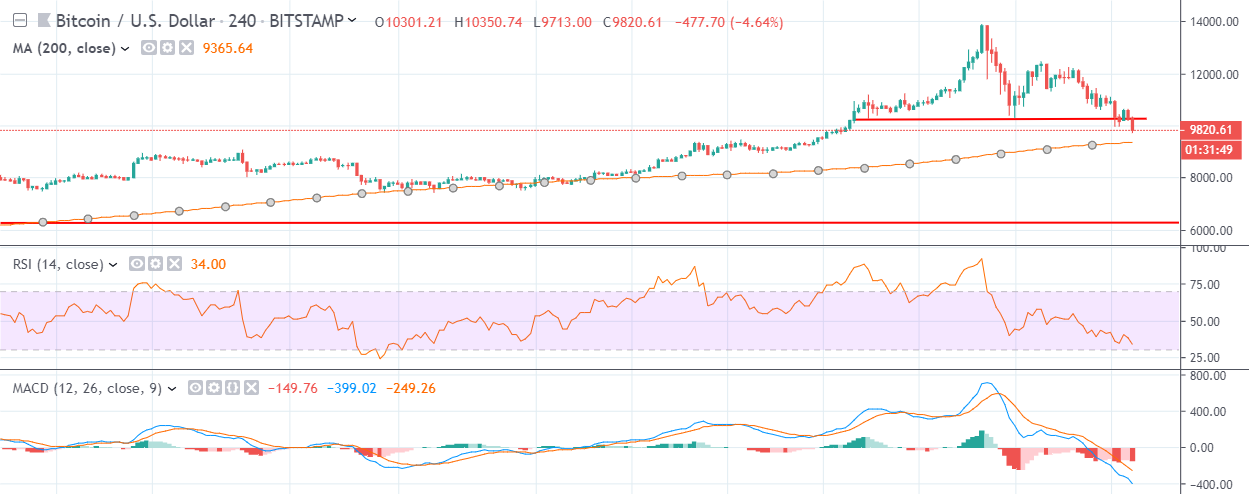
- Bitcoin has a neutral short-term bias, with the cryptocurrency testing towards its 200-period moving average on the four-hour time frame
- The four-hour time frame shows a bearish head and shoulders pattern
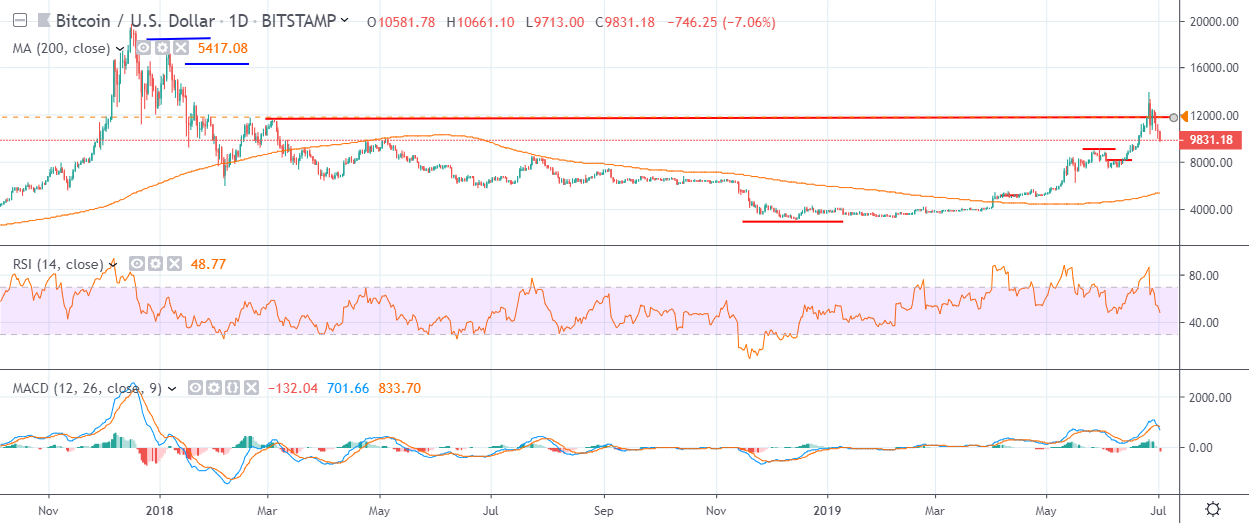
- Technical indicators on the daily time frame are starting to correct from overbought readings
Bitcoin / USD Short-term price analysis
Bitcoin has a neutral short-term trading outlook, with the BTC / USD pair reversing back towards its 200-period moving average on the four-hour time frame.
The four-hour time frame is showing that the BTC / USD pair has fallen below the neckline of a head and shoulders pattern. The neckline of the bearish pattern is currently located at the $10,200 level.
Key short-term technical resistance is currently located at the $9,200 and $8,800 levels.
Technical indicators on four-hour time frame are bearish and issuing a sell signal.
Pattern Watch
Short-term traders should note that the overall downside target of the bearish pattern is located close to the $6,000 support level.
Relative Strength Index
The Relative Strength indicator on the four-hour time frame is bearish and continues to point lower.
MACD Indicator
The MACD indicator on the four-hour time frame is bearish and continues to generate a strong sell signal.
Bitcoin / USD Medium-term price analysis
Bitcoin has a bullish medium-term trading outlook, with the BTC / USD pair still holding price above major technical support on the daily time frame.
The daily time frame is showing that the BTC / USD pair has undergone a strong technical reversal, after falling under the neckline of a large inverted head and shoulders pattern.
Key technical support on the daily time frame is currently located at the $9,200 and $8,000 levels.
Technical indicators on the daily time frame are undergoing a much-needed bearish correction.
Pattern Watch
Traders should note that the bullish inverted head and shoulders pattern on the daily time frame may be in the process of carving out a right-hand shoulder.
Relative Strength Index
The Relative Strength indicator on the daily time frame has turned bearish and still has significant scope to trade lower.
MACD Indicator
The MACD indicator on the daily time frame is bearish on the daily time frame and is now issuing a sell signal.
Conclusion
Bitcoin is undergoing a much-needed technical correction, with BTC / USD selling starting to pick-up now that the $10,200 support level has been broken.
The bearish pattern on the four-hour time frame highlights that a much stronger move lower can occur if the $9,200 support level is breached.
Bitcoin was the first of our coin guides, and is also our highest-rated deep research project.