Bitcoin Price Analysis BTC / USD: Correction Doesn’t Invalidate Trend
Bitcoin can't go up forever, but the correction doesn't invalidate its bullish trend.
- Bitcoin has started to correct lower in short-term after buying interest above the $8,000 level began to wane
- The four-hour time frame is currently showing a bearish head and shoulders pattern
- Both the four-hour and daily time frame still remain technically bullish
Bitcoin / USD Short-term price analysis
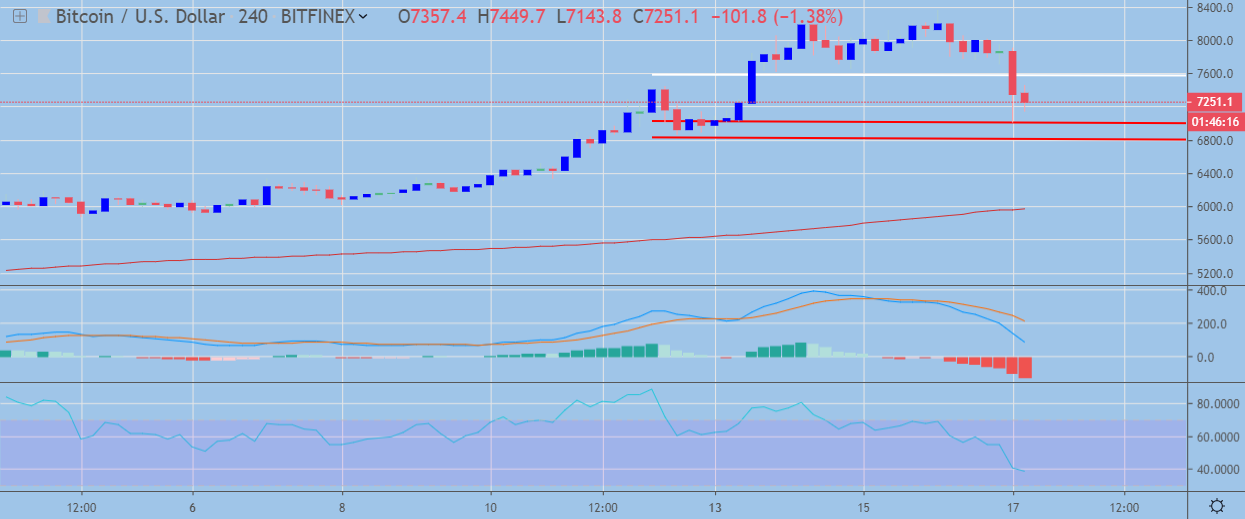
Bitcoin has a bullish short-term trading outlook, with the BTC / USD pair still trading above its 200-period moving average despite the large technical correction lower.
The four-hour time frame is showing that a bearish head and shoulders pattern has been created, with the BTC / USD pair failing below neckline support.
Technical indicators on four-hour time frame have turned bearish and generate strong sell signals.
 BTC / USD H4 Chart by TradingView
Pattern Watch
Traders should note that if the BTC / USD pair falls towards the $6,800 level a much larger head and shoulders pattern will form on the four-hour time frame.
Relative Strength Index
The Relative Strength indicator on the four-hour time frame has turned bearish and can still trade lower.
MACD Indicator
The MACD indicator on the four-hour time frame has turned bearish and shows scope for further downside.
Bitcoin / USD Medium-term price analysis
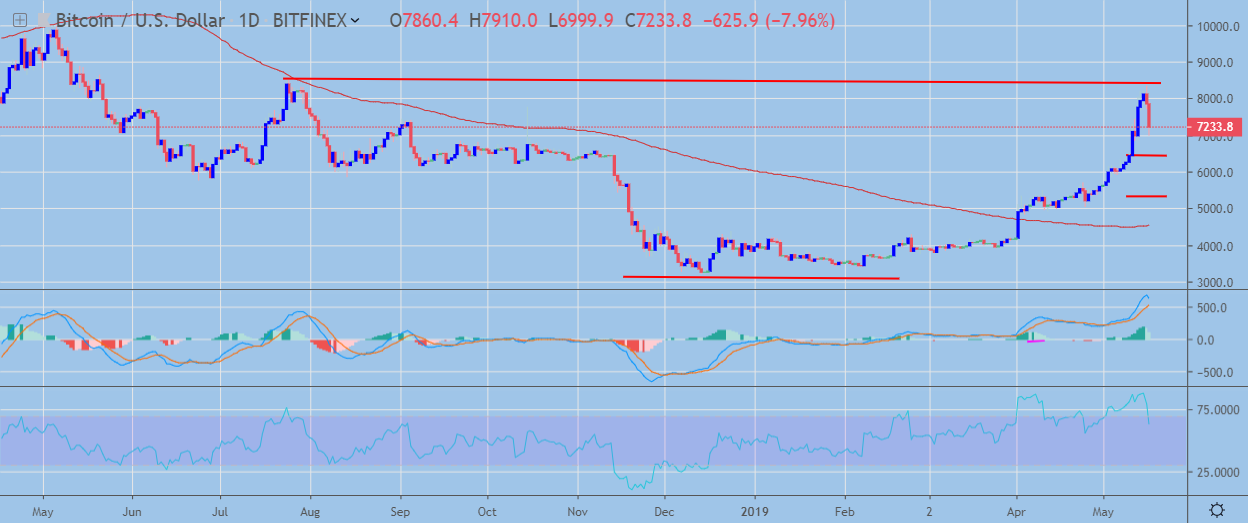
Bitcoin remains bullish bias over the medium-term horizon, with the BTC / USD pair still trading way above its trend-defining 200-day moving average.
The daily time frame is showing that a strong technical correction is currently underway after the BTC / USD pair formed a large inverted head and shoulders pattern, but crucially failed to move price above the neckline of the pattern.
Technical indicators on the daily time frame are starting to turn bearish and have significant downside potential.
 BTC / USD Daily Chart by TradingView
Pattern Watch
Traders should note that the daily time frame is highlighting the $6,500 and $5,400 levels as major downside technical support.
Relative Strength Index
The Relative Strength Index is bullish, although it is now correcting lower alongside the recent decline.
MACD Indicator
The MACD indicator on the daily time frame is attempting to turn bearish and is still extremely overbought.
Conclusion
Bitcoin is starting to correct lower in short-term after reaching its initial bullish target above the important $8,000 resistance level.
While the bearish pattern on the four-hour time frame points to an even deeper technical correction for BTC / USD pair, the bullish pattern on the daily time frame still suggests the number one cryptocurrency can trade much higher over the medium-term.
Check out our coin guide for Bitcoin if you’re here by accident.