
Bitcoin’s On-Chain Indicators Flash Buy Despite Price Stagnation
Bitcoin continues consolidating within a narrow trading range while several on-chain metrics add credence to the bullish outlook.
Despite Bitcoin’s current price stagnation, on-chain indicators favor the bulls, with most holders remaining unphased by market volatility.
Bitcoin’s Ambiguous Technical Indicators
The technical outlook for the flagship cryptocurrency remains stagnant. There are conflicting signs of where it will head next, with prices leveling off over the past few weeks.
From a technical perspective, Bitcoin’s price has been contained within an ascending triangle that began developing in early May. This technical formation is considered to be a continuation pattern that estimates an 18.5% target upon the breakout point.
An increase in the buying pressure behind BTC that allows it to move past the infamous $10,000 resistance level may ignite a state FOMO among investors. If this were to happen, the bellwether cryptocurrency could rise towards $12,000.
Breaking below the hypothenuse of the triangle, however, will jeopardize the bullish outlook. An increase in sell orders around the current price level may have the strength to push Bitcoin below $7,800.
Despite uncertainty around the pioneer cryptocurrency, different on-chain metrics add credence to the optimistic scenario.
Buy Signals Popping Up
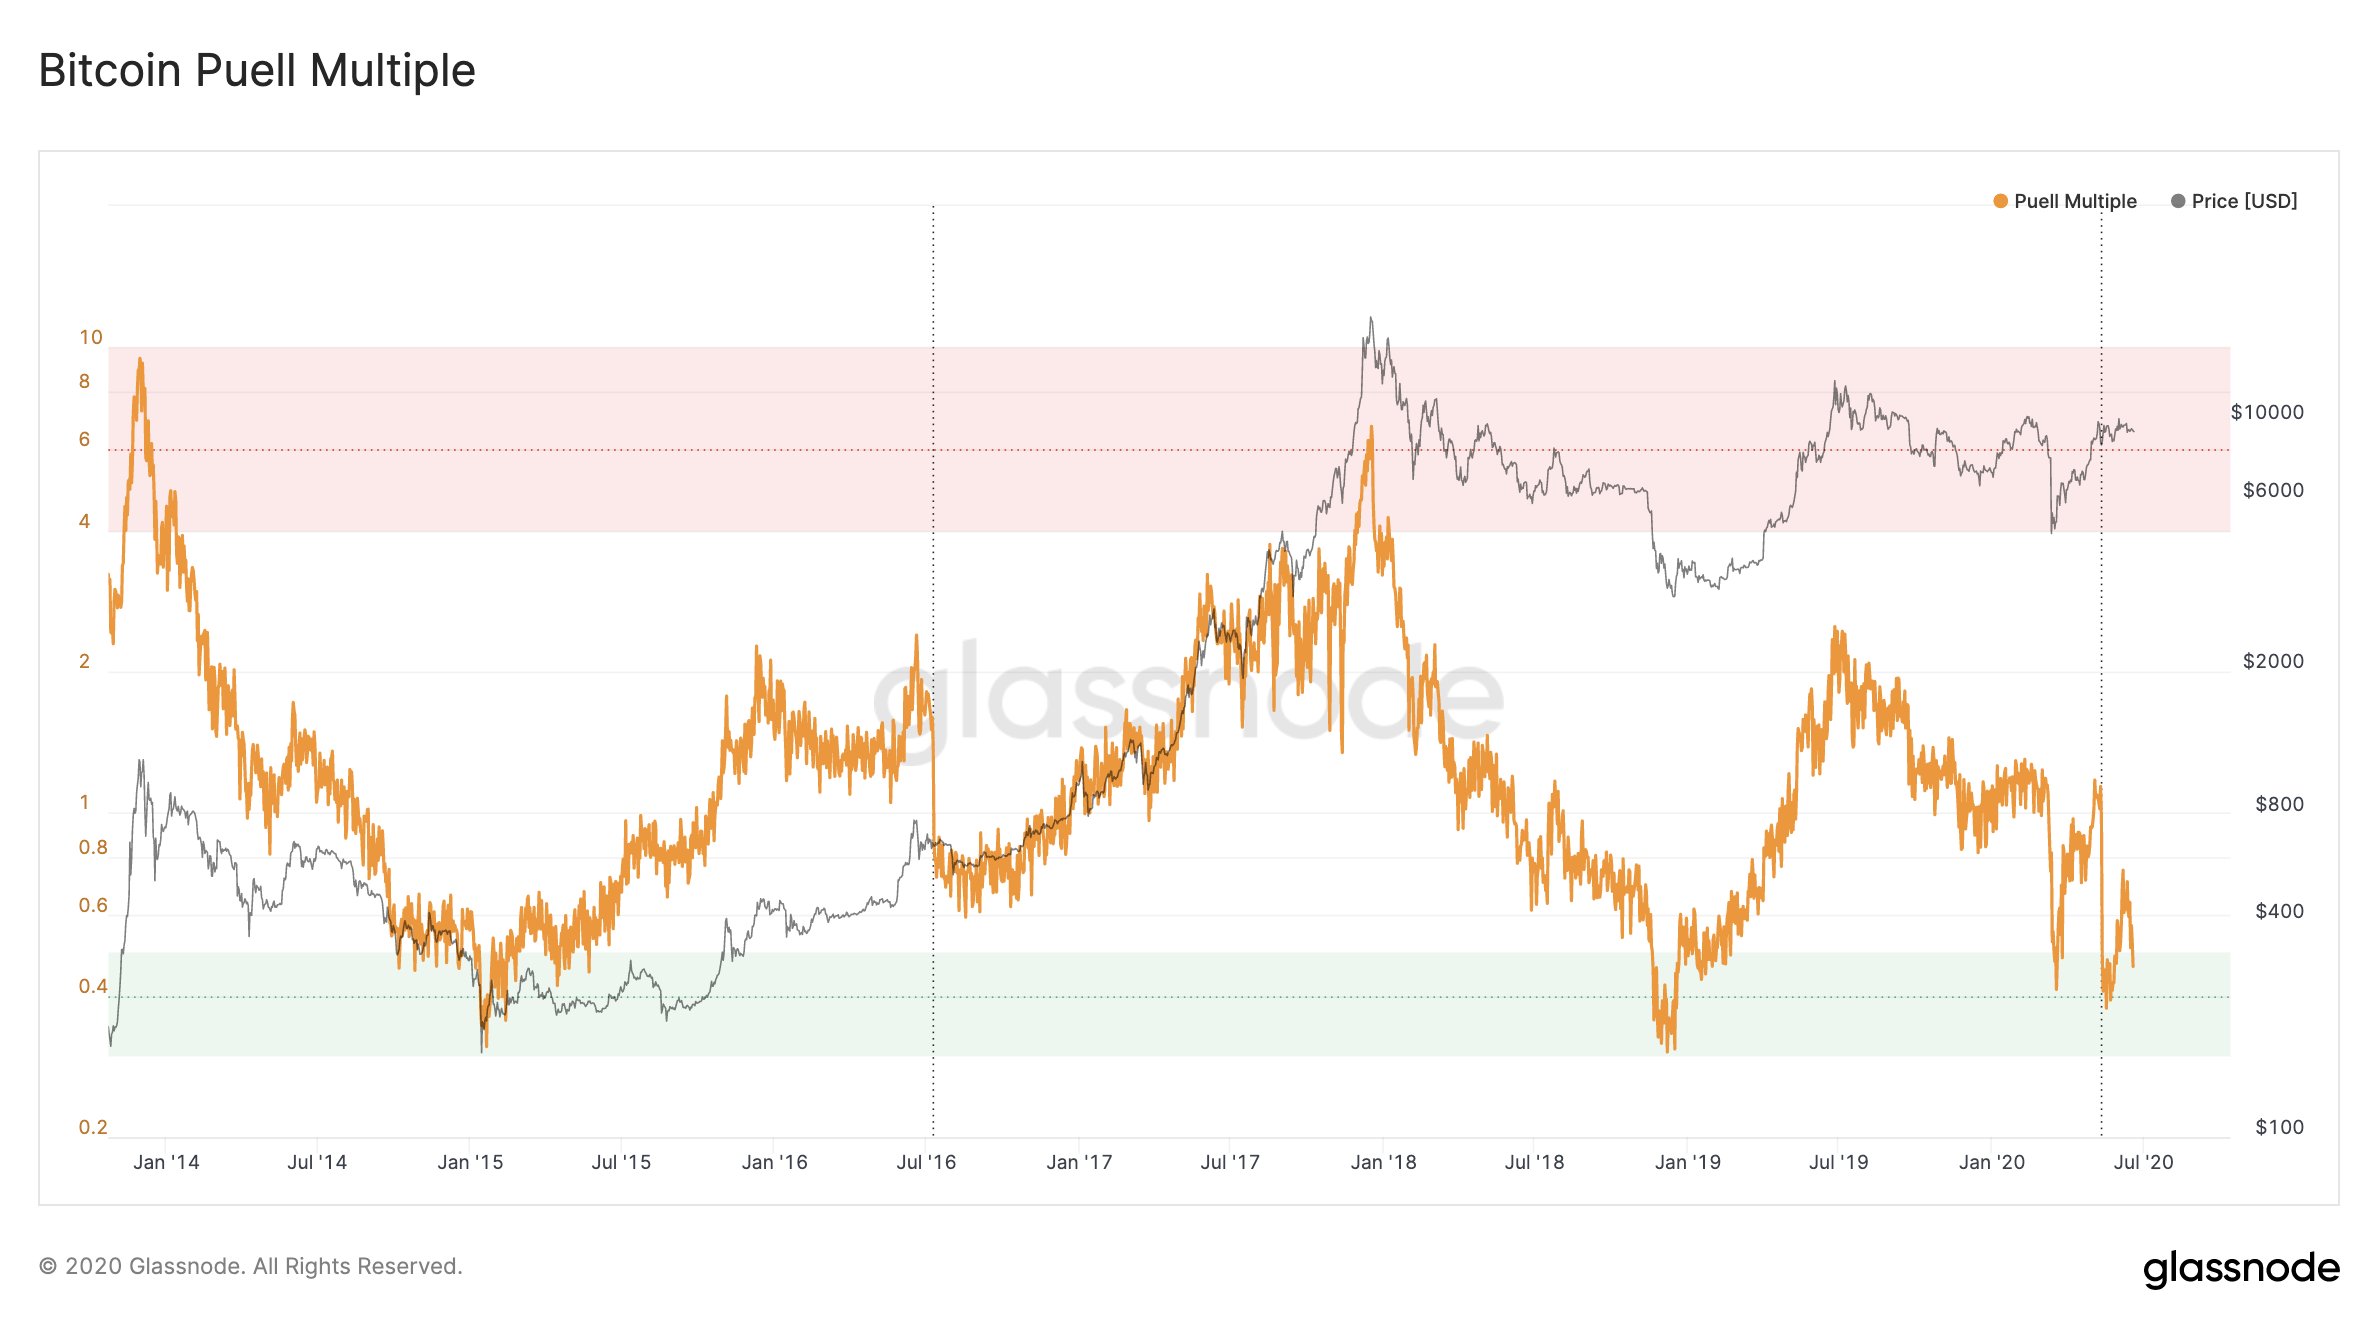
Indeed, the Bitcoin Puell Multiple is back in the “buy zone” after moving outside this area in mid-May. This fundamental gauge determines the stage of the market cycle from a mining-revenue perspective.
When the value of daily-issued Bitcoin hits historic lows, then traders have a chance to profit. When the daily issuance value is high, it indicates an approaching exhaustion point.
“For investors with long-term time horizons these levels below the 0.5 line have historically marked excellent entry points into Bitcoin,” said Glassnode.
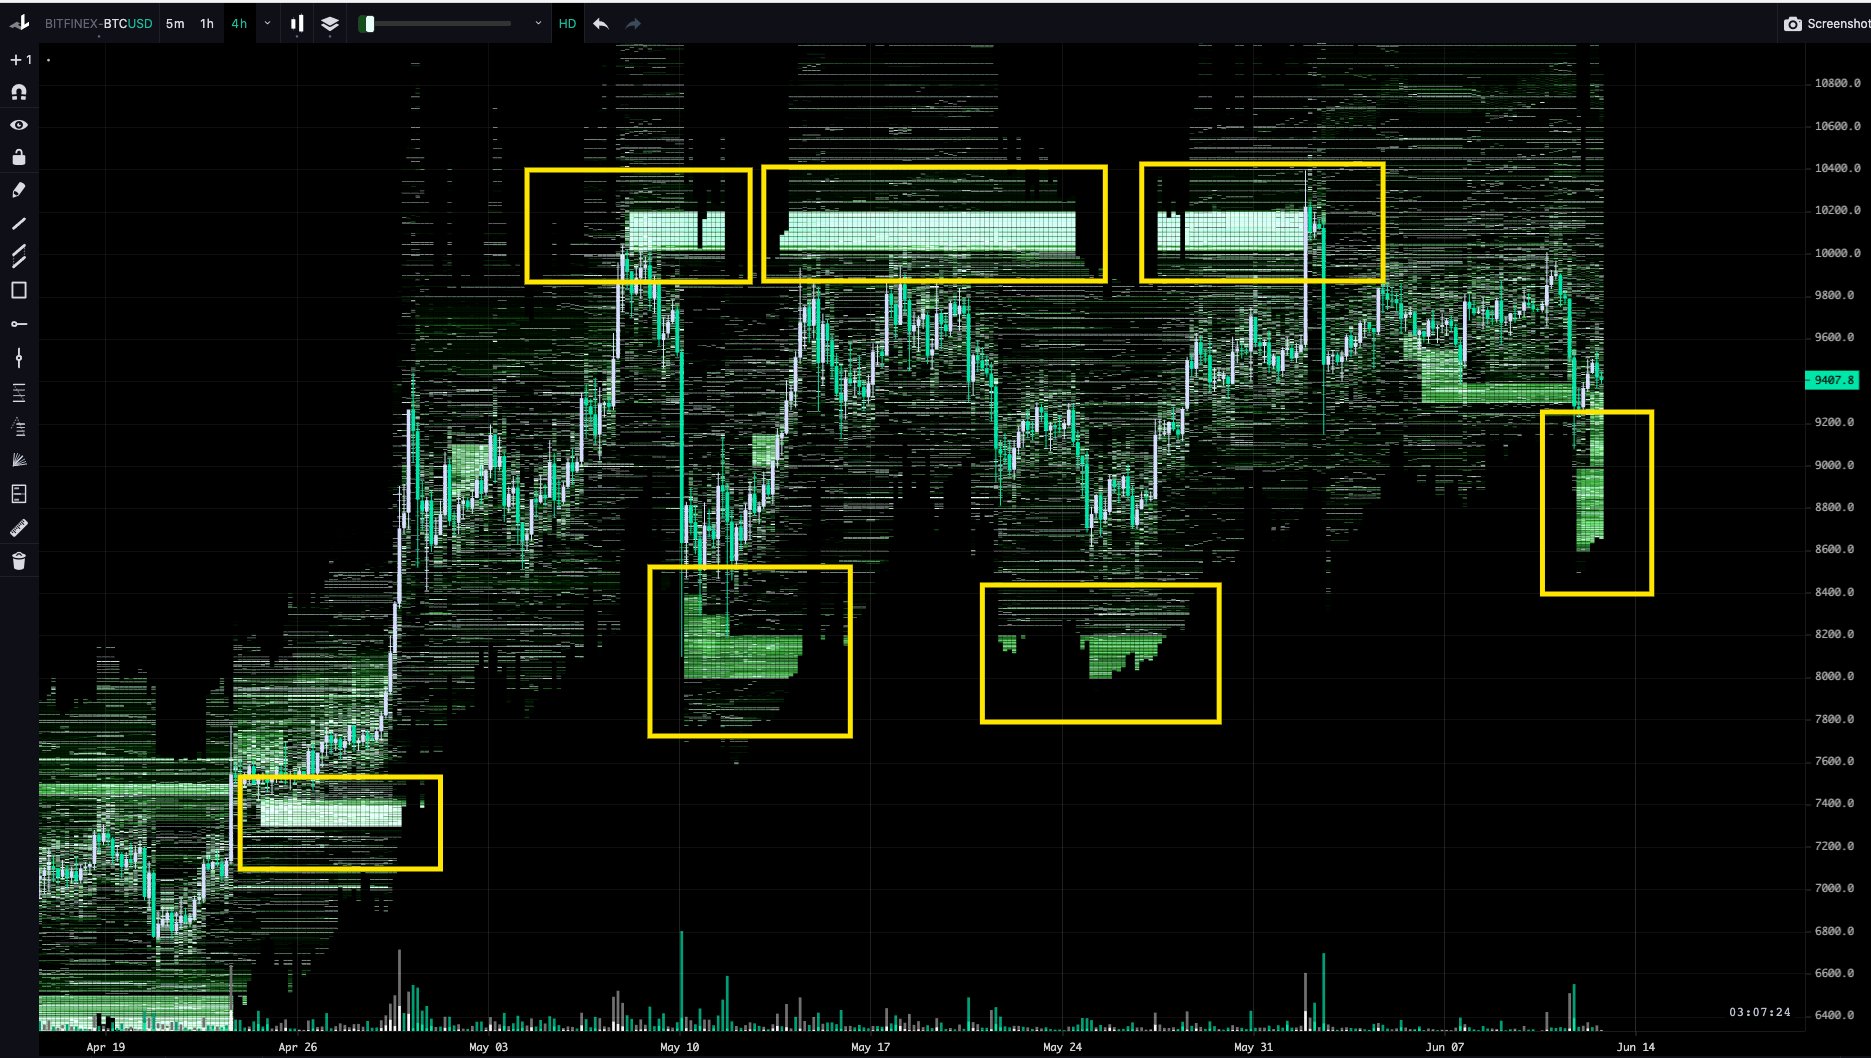
Along the same lines, on-chain analyst Cole Garner maintains that Bitfinex’s order book seems to favor the bulls. The leveraged BTC long positions and the spot long orders on the Hong Kong-based cryptocurrency exchange reflect a similar number of entries, which is “very bullish,” according to the chartist.
The high concentration of long leveraged and spot orders around crucial support levels help anticipate upswing, especially over the last three months. Garner has recently put a lot of emphasis on this metric, which may prove lucrative once again.
Regardless, IntoTheBlock’s “In/Out of the Money Around Price” (IOMAP) reveals that there is a massive resistance barrier ahead that Bitcoin must overcome if the bullish outlook is to materialize.
Based on this on-chain index, roughly 2.2 million addresses had previously purchased 1.42 million BTC between $9,300 and $9,600. Such a significant supply wall could have the ability to absorb any upside pressure; underwater addresses tend to try and break-even on their positions in the event of an upswing.
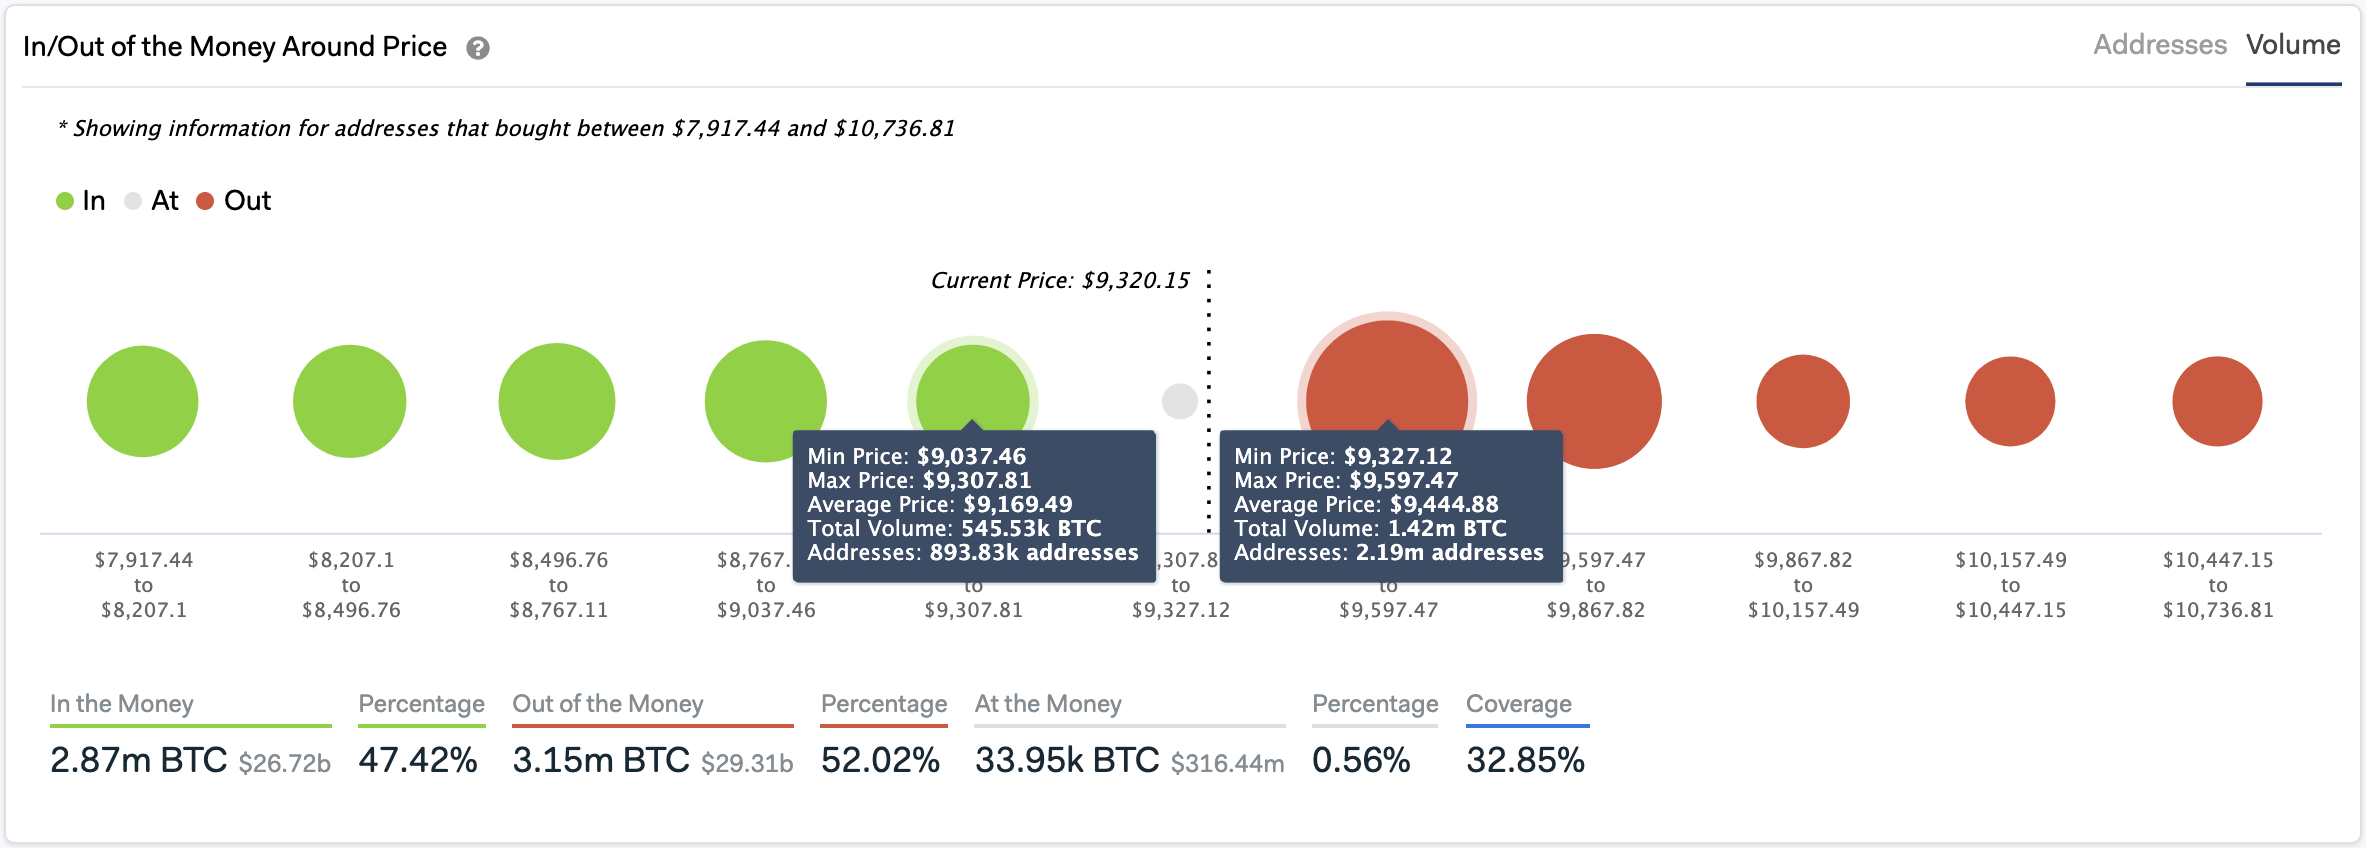
On the reverse, the IOMAP cohorts show that approximately 900,000 addresses bought more than 545,000 BTC between $9,000 and $9,300. Holders within this price range may try to remain profitable in their long positions. They may even buy more Bitcoin to avoid prices from falling below this level, according to IntoTheBlock.
The Crypto Market Moves Forward
The recent price action that Bitcoin has gone through certainly created a sense of uncertainty in the cryptocurrency market. The Crypto Fear and Greed Index reveals that market participants are fearful about what the future holds. Meanwhile, Santiment’s social sentiment index shows that the chatter around Bitcoin on Twitter has also grown pessimistic.
The rising concerns regarding the price of Bitcoin, however, is not affecting the whole investor base behind it. In fact, a recent report from Chainalysis shows that more than 80% of the addresses holding a balance in BTC continue to hold steady.
Roughly 19% of Bitcoin’s circulating supply is used for trading, while 60% is “held by entities that have never sold more than 25% of Bitcoin they’ve ever received.” The remaining 20% has not exchanged hands in five years or longer, with Chainalysis considering them as “lost Bitcoin.”

Based on this information, it is imperative to wait for a clear break of the support or resistance levels previously mentioned before entering a trade. The ascending triangle that is forming on BTC’s daily chart presents an ambiguous outlook. Those who bet on the wrong side of the trend could get wiped-out, especially if leverage is used, so caution is a must.
Therefore, a small dose of patience can play a significant role in helping traders profit from Bitcoin’s next major price movement.