
Bitcoin’s Recent Correction Turns Support into Resistance, Suggesting Further Losses
Bitcoin seems poised for a wild downward ride despite the high levels of euphoria that have taken over the market.
Bitcoin has been rejected several times by a crucial resistance level over the past few days, which was the only obstacle before heading towards $14,000. Now, several on-chain and technical metrics suggest that a steep correction is imminent.
Greed Takes Over
Market participants became “extremely greedy” on Tuesday, Aug. 11, after the flagship cryptocurrency took another aim at the $12,000 mark.
But, as has happened in the past, Bitcoin’s hidden forces took advantage of such an overwhelming sense of optimism to turn the market around.
Roughly 47,000 BTC were sent to different cryptocurrency exchanges while the uptrend was reaching exhaustion. The spike in selling pressure, combined with a massive number of margin calls on overleveraged long positions, triggered a nearly 7% correction that saw Bitcoin drop to a low of $11,127.
Although the pioneer cryptocurrency was able to recover and move back above the $11,400 support level, the uptrend that began in early July may have been compromised by the recent price action.
Bitcoin Is Bound for Further Losses
IntoTheBlock’s “In/Out of the Money Around Price” (IOMAP) model reveals that Bitcoin lost a critical support level that was acting as stiff support.
Based on this on-chain metric, the area between $11,530 and $11,860 was significant for the uptrend to continue. Approximately 1.3 million addresses had previously purchased over 1 million BTC around this price range.
Now that the bellwether cryptocurrency has moved below this zone, it is very likely that it will act as a stiff resistance. Holders within this price pocket may try to break even in their long positions when Bitcoin rises, preventing it from reaching its upside potential.
But in the event of a sharp decline, these investors might even panic-sell their holdings to avoid further losses, pushing prices lower.
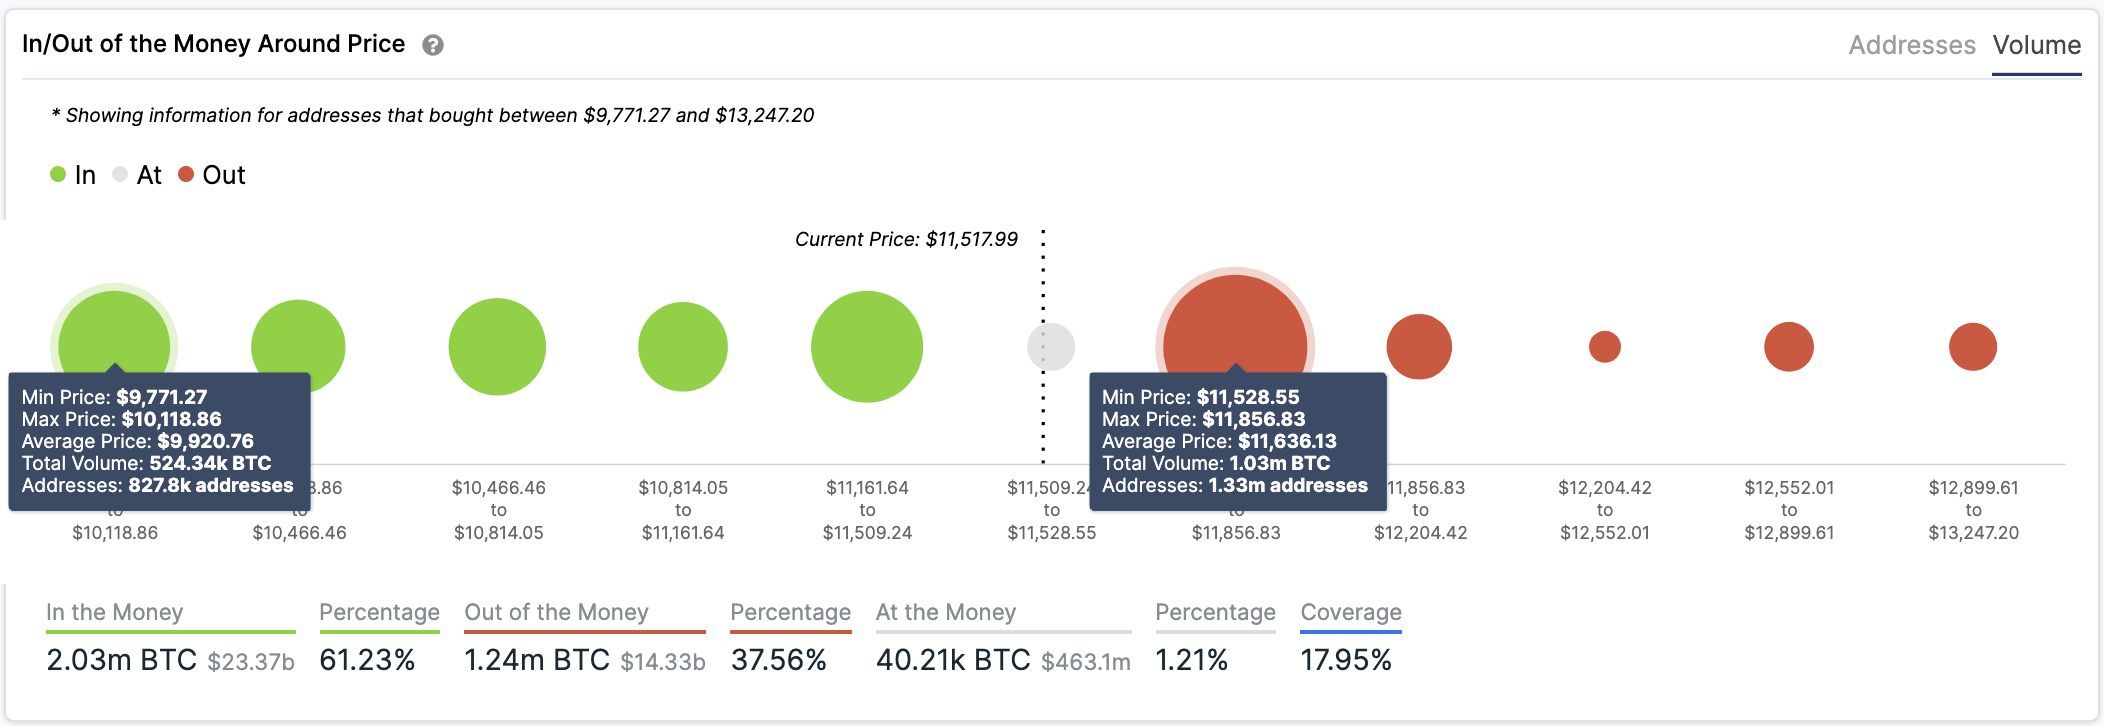
Under such circumstances, the IOMAP cohorts show that the most critical area of interest underneath Bitcoin lies between $9,770 and $10,120.
Here, nearly 830,000 addresses bought more than 520,000 BTC. This considerable supply barrier may have the ability to prevent prices from continuing to fall as sidelined investors would likely try to re-enter the market.
It is worth mentioning that the TD sequential indicator is about to present a sell signal on Bitcoin’s 3-day chart. The bearish formation would likely develop as a green nine candlestick, suggesting a one to four three-day candlesticks correction before the uptrend resumes.
The TD index has been incredibly accurate at predicting BTC’s local tops and bottoms, based on historical data. It even presented a buy signal in early July, just before prices surged over 33%.
Given this significant upswing, a correction from the current price levels may help strengthen the macro-uptrend and propel prices to new yearly highs.
It is advisable to implement a robust risk management strategy when trading Bitcoin despite all the bearish signs previously mentioned. A spike in buy orders that allows BTC to slice through the $11,640 resistance may result in a jump towards the $12,000 resistance barrier.
If this were to happen, traders must watch out for a daily candlestick close above this price hurdle since it would likely jeopardize the bearish outlook and lead to a run-up towards $14,000.