Despite Crash, Metrics Show Bitcoin Will Continue Climbing
Bitcoin's price is going wild, reaching recent highs before a sharp drop Sunday. Whales are using this as an opportunity to accumulate, raising the likelihood of a continued bullish advance.

Key Takeaways
- Bitcoin's price crashed by $1,700 within minutes after reaching a new yearly high of nearly $12,160
- Data reveals that as prices plummeted, large whales added more BTC to their positions
- If the buying spree by big investors continues, the pioneer cryptocurrency could bounce back and resume its historic bull trend
Share this article
After reaching new yearly highs, Bitcoin crashed and lost a critical level of support. Nevertheless, different metrics reveal that the uptrend has not been interrupted and that BTC prices will continue climbing.
Bitcoin Crashes While Whales Accumulate
The pioneer cryptocurrency made headlines after breaking out of a two-month-long consolidation period. Moving past the infamous $10,000 resistance barrier on July 27 triggered a state of FOMO among market participants. As the buying pressure behind BTC rose exponentially, its price shot up over 21.5% to hit a new yearly high of nearly $12,160.
A few minutes after reaching this milestone, however, Bitcoin suddenly crashed by roughly $1,700 to a low of $10,490. The bearish impulse caused the liquidation of more than $1.3 billion worth of BTC futures contracts as investors grew overwhelmingly greedy. Following the downswing that flushed out some weak hands, prices were able to partially recover and stabilize around the $11,100 mark.
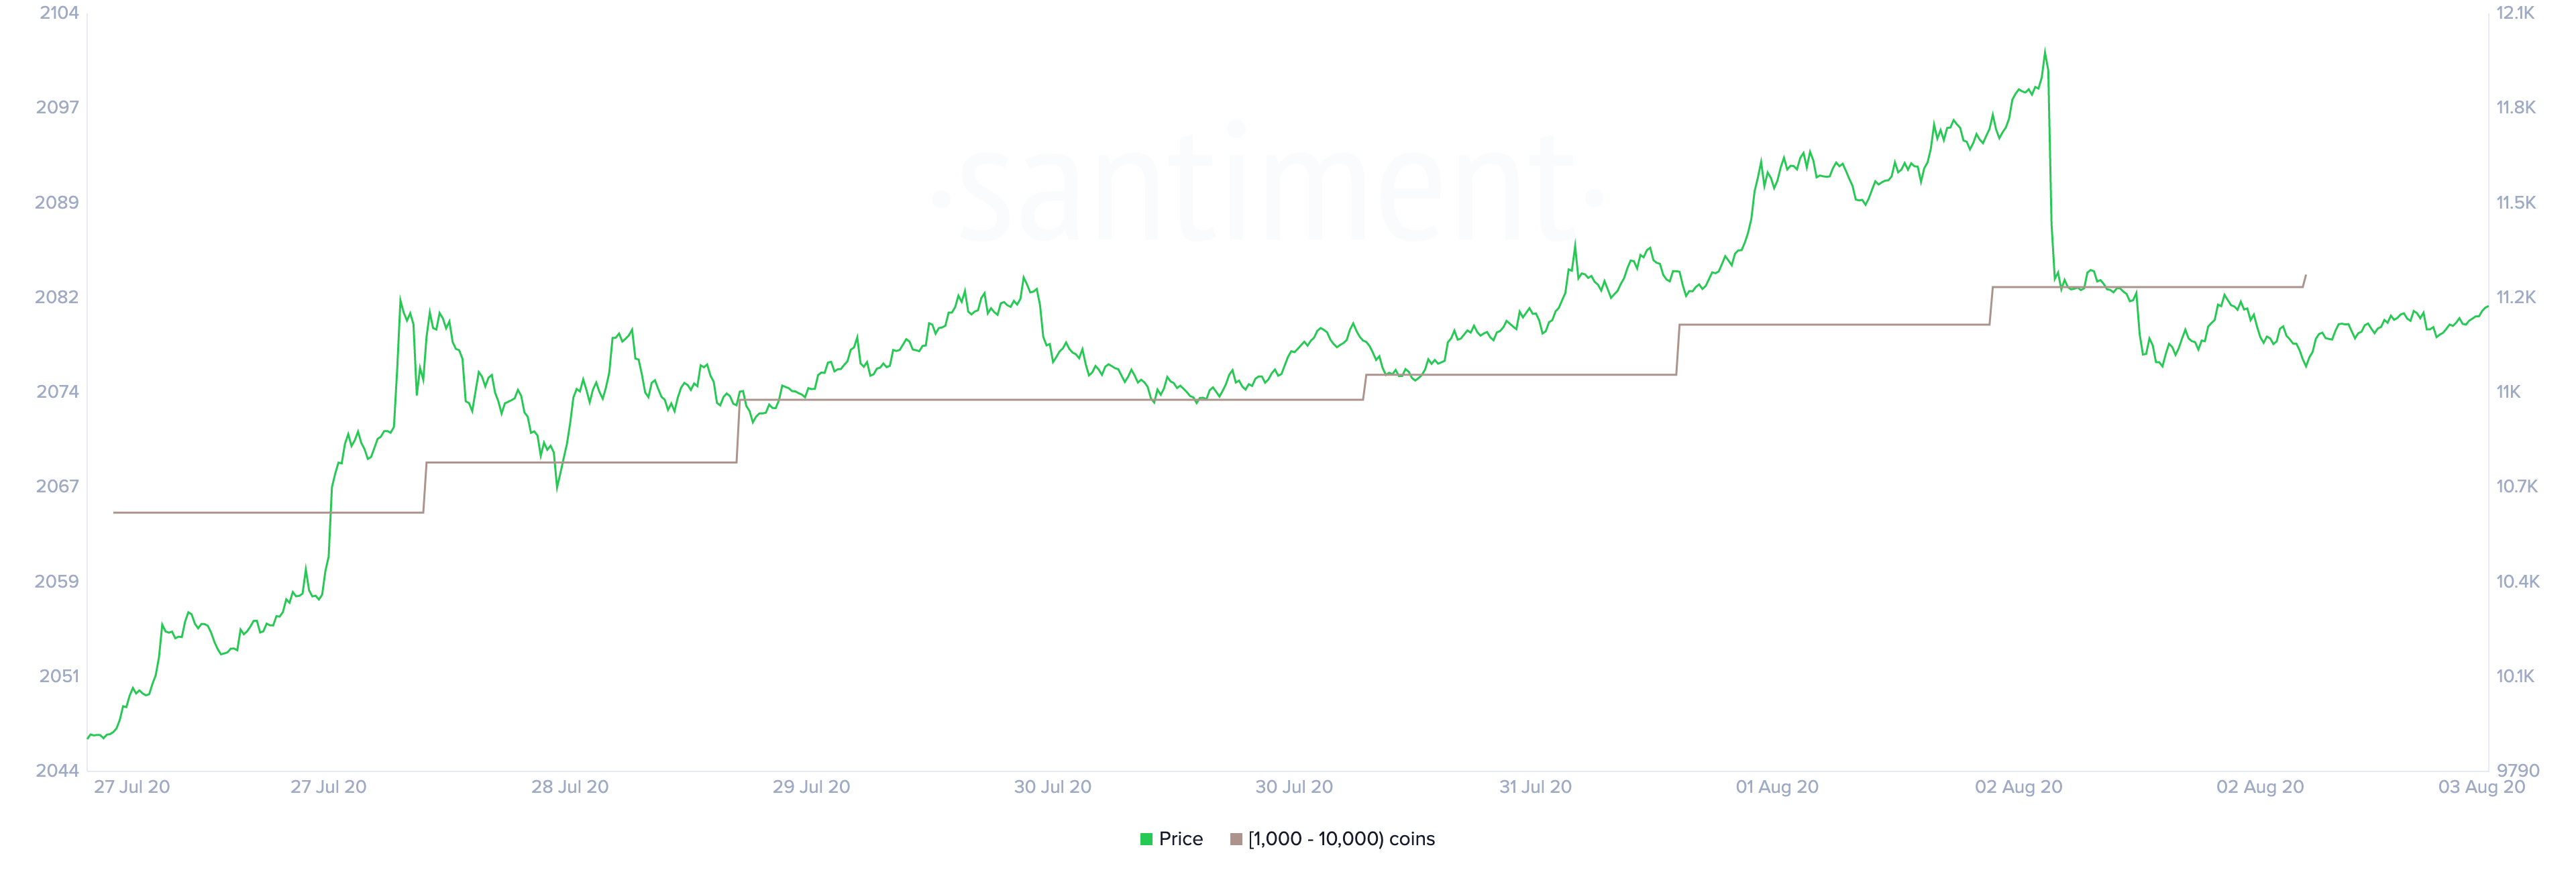
Regardless of the erratic price action, big investors holding millions of dollars in Bitcoin, colloquially known as “whales” within the cryptocurrency industry, seem to have taken advantage of the move to accumulate more tokens. Santiment’s holder distribution chart recorded a spike in the number of addresses holding between 1,000 and 10,000 BTC as prices dropped. Roughly three new whales joined the network during the recent market crash.

The sudden spike in large investors may seem insignificant at first glance. Still, when considering that they hold between $11.3 million and $113 million in BTC, the increase in buying pressure translates into tens, or even hundreds, of millions of dollars.
BTC Prices Aim to Recover
The bellwether cryptocurrency has remained dormant following the recent market crash. The lackluster price action seen since then forced one notable indicator, the Bollinger bands, to squeeze on BTC’s 1-hour chart. This behavior indicates that momentum for a significant price movement is building up slowly. The longer the squeeze, the higher the probability of a strong breakout.
Although this technical index does not provide a clear path for Bitcoin’s direction, a pennant seems to be developing within the same time frame. This technical formation was created as a direct result of BTC’s price movement after the crash. Two trendlines that converge can be drawn along with the swing highs and lows.
By measuring the distance between the pennant’s highest points and adding it to the breakout point, this pattern estimates a potential upside target of over 3%, a rebound of roughly $350.
If the buying spree by large investors continues, Bitcoin could bounce back and rise towards $11,600, reaching the target presented by the pennant.
Major Supply Barrier Ahead
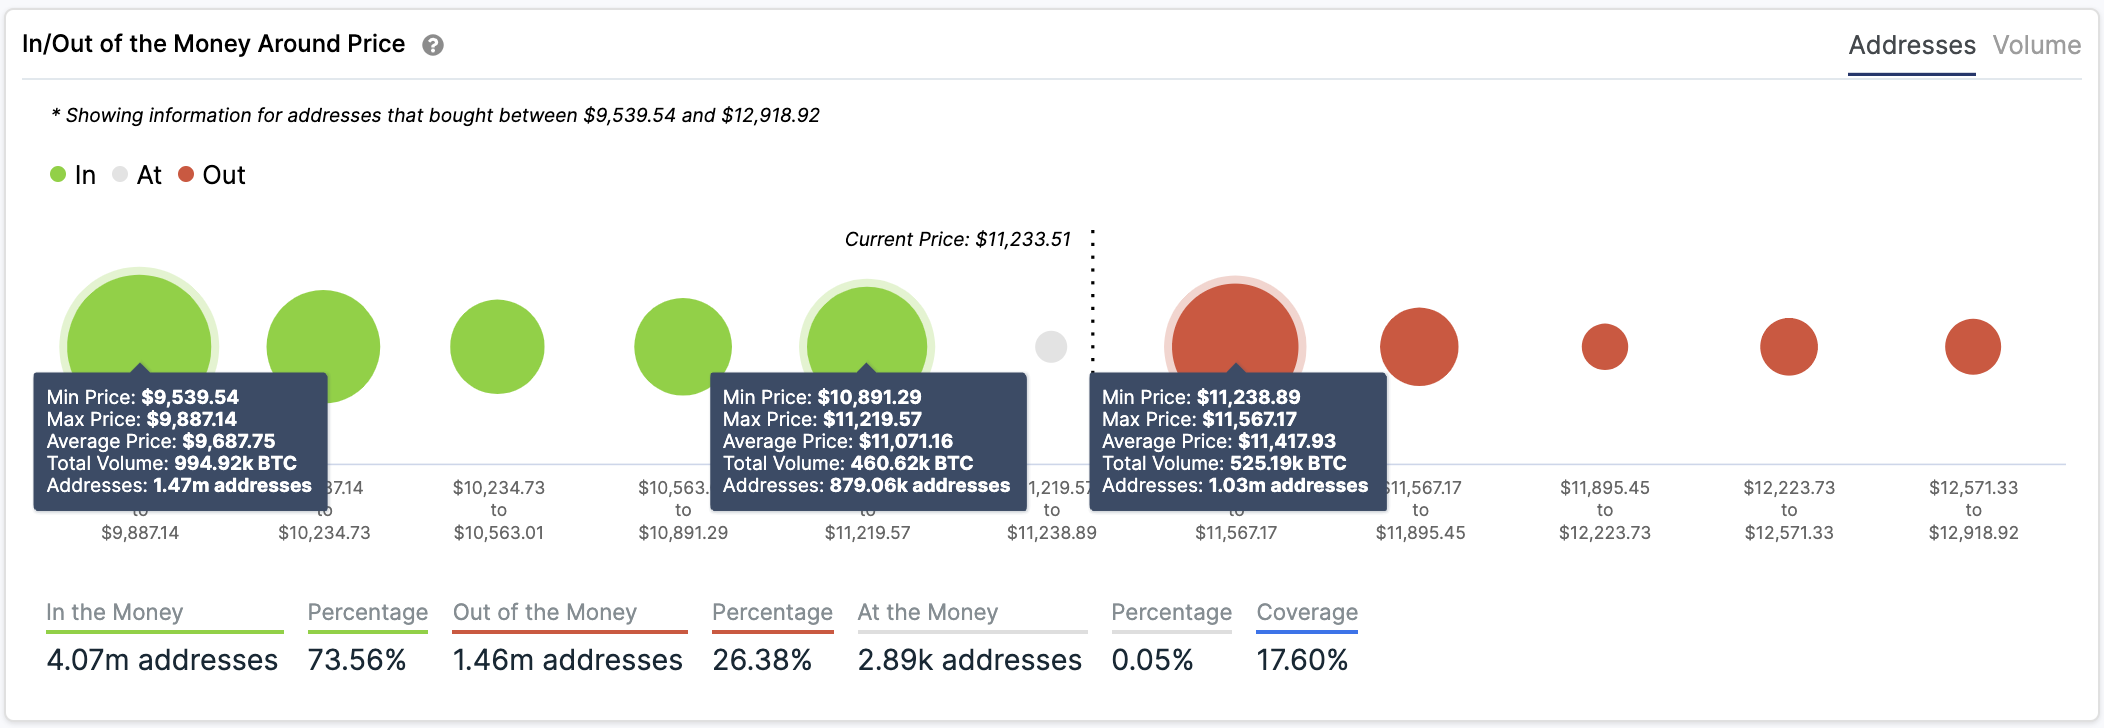
IntoTheBlock’s “In/Out of the Money Around Price” (IOMAP) model reveals that such a bullish impulse will not be easy to achieve. Based on this on-chain metric, more than 1 million addresses had previously purchased over 525,000 BTC between $11,240 and $11,560.
This massive supply barrier may have the ability to prevent Bitcoin from advancing further. Holders within this range will likely try to break even in their long positions when prices rise. But if the buying pressure behind the flagship cryptocurrency is significant enough, it may slice thought this resistance level and aim for new yearly highs.
The IOMAP cohorts show that there aren’t major supply barriers ahead of the $11,600 mark that will prevent Bitcoin from surging towards $13,000 or higher.

Conversely, this fundamental gauge suggests that several areas of interest may hold in the event of a correction. The $11,100 price hurdle might be able to absorb any downward pressure. Approximately 880,000 addresses are holding over 460,000 BTC around this level.
Bitcoin Moves Forward
Following the recent price action, some of the most prominent analysts in the industry believe that Bitcoin reached a market top. The latest rejection off of the $12,000 level could result in a pullback to $9,000. However, other renowned chartists, such as Tone Vays, maintain that the flagship cryptocurrency has entered a new bullish cycle.
The former Wall Street trader and VP at JP Morgan Chase affirmed that Bitcoin’s price action is “about the same” as the Nasdaq between 2000 and 2016. Although the NDX took over 16 years to break above its all-time high after the dot-com bubble exploded, the pioneer cryptocurrency is moving “more than half as fast.”
“Now that Bitcoin moved past the $10,000 resistance, it may take about a year or so to test its previous all-time high. If it sticks with the pattern, by October 2021 BTC could rise over 100%,” said Vays.
Given the bullish outlook, traders must implement a robust risk management strategy when trading Bitcoin to avoid adverse market conditions. As BTC appears to have entered a new bull market, having cash ready to deploy is a must.
Share this article
