
BTC / USD Price Analysis: Shock Therapy
Tether news plunged the market downwards, but Bitcoin still has solid support just below $5000.
- Bitcoin retains its bullish short-term outlook, with the BTC / USD pair still trading above its 200-period moving average
- The four-hour time frame shows that a bearish head and shoulders pattern could be forming
- The medium-term outlook for the BTC / USD pair remains bullish while price trades above the $4,500 level
BTC / USD Short-term price analysis
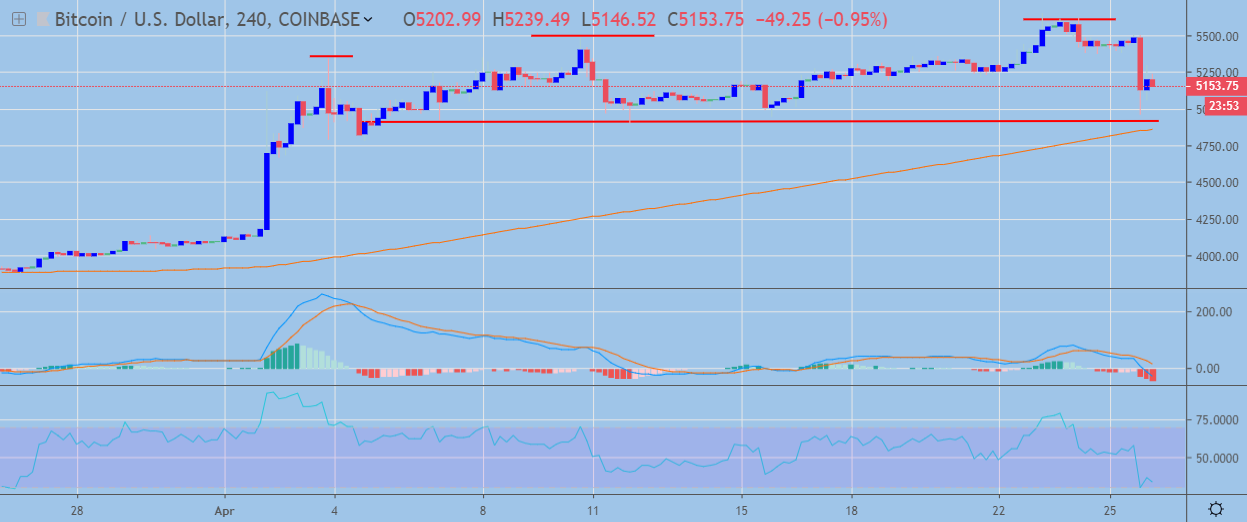
Bitcoin retains its bullish short-term trading bias, with the BTC / USD pair still trading above its 200-period moving average on the four-hour time frame despite the recent decline.
The four-hour time frame is showing that a strong technical correction is underway, with the April 12th swing-low the key area to watch if the decline continues.
Technical indicators on four-hour time frame have now turned bearish and are continuing to issue strong sell signals.
 BTC / USD H4 Chart by TradingView
Pattern Watch
Traders should note that a bearish head and shoulders pattern could start to form on the four-hour time frame.
Relative Strength Index
The Relative Strength Index indicator on the mentioned time frame is bearish and continues to point lower.
MACD Indicator
The MACD indicator on the four-hour time frame has turned bearish, with the MACD signal line and MACD histogram issuing a strong sell signal.
Fundamental Analysis
Although Bitcoin has been bullish over the past few weeks, the news that NY prosecutors have accused Bitfinex exchange of covering $850 million loss using Tether funds has generated a sell-off in the market.
BTC / USD Medium-term price analysis
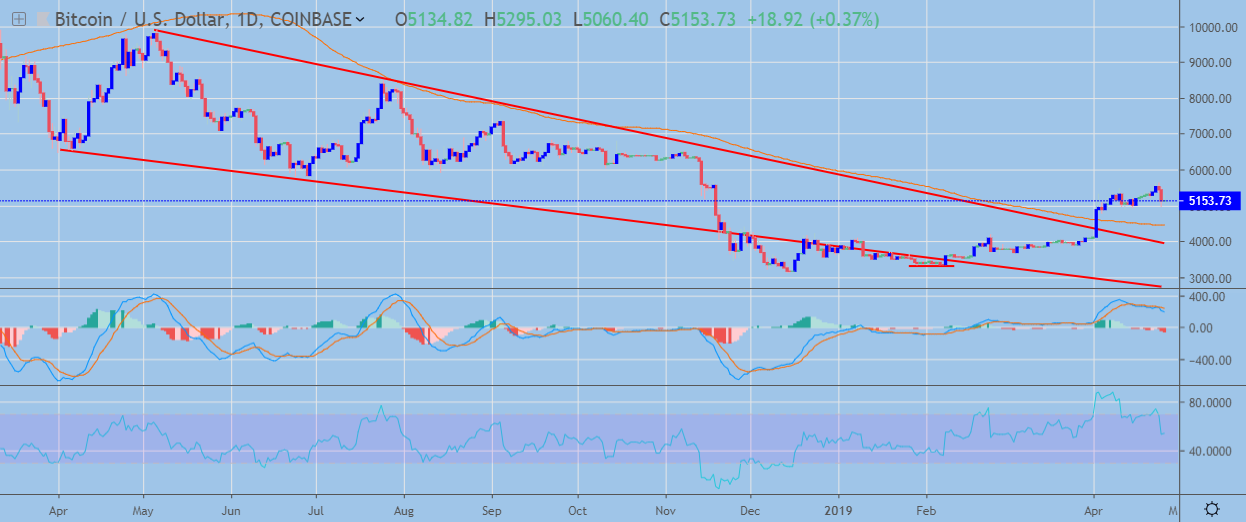
Bitcoin retains its bullish medium-term trading bias, with the BTC / USD pair still holding above its 200-day moving average.
The daily time frame is showing that major support below the $4,900 level is located at the BTC / USD pair’s 200-day moving average, at $4,500. The falling wedge on the mentioned time frame is critical technical support for the BTC / USD pair, at $3,900.
Technical indicators on the daily time frame have turned bearish and show scope for further downside.
 BTC / USD Daily Chart by TradingView
Pattern Watch
Traders should note that the major bullish breakout on the daily time frame still remains valid while price trades above trendline support, at $3,900.
Relative Strength Index
The Relative Strength Index has turned bearish and also shows scope for further downside.
MACD Indicator
The MACD indicator on the daily time frame has turned bearish and shows scope for further downside.
Fundamental Analysis
The medium-term prospects for Bitcoin remain highly speculative. However, on a fundamental level its transaction count is approaching late 2017 bull-run levels, which is a clear sign of recovering adoption. If this trend continues, it will likely be only a matter of time before price follows.
Conclusion
Bitcoin has started to correct lower after finding strong technical resistance from the $5,600 level. The BTC / USD pair could trade even lower if short-term sellers can hold price below the $4,900.
The BTC / USD pair’s medium-term outlook remains bullish above the $4,500 level, while moves below the $3,900 level could trigger major technical selling.
To get a quick refresher course on Bitcoin check out our coin guide here.