
Nexo Earn with Nexo
Warren Buffett Indicator reaches record 236%, surpassing dot-com peak by a wide margin

Warren Buffett Indicator reaches record 236%, surpassing dot-com peak by a wide margin

The legendary investor's favorite valuation metric now shows US stocks are worth 2.36 times GDP, well past the level Buffett himself said meant 'playing with fire.'

The stock market valuation metric that Warren Buffett once called “probably the best single measure of where valuations stand at any given moment” just hit a number that would make even the Oracle of Omaha uncomfortable. The Warren Buffett Indicator, which measures total US stock market capitalization relative to GDP, has climbed to 236%.

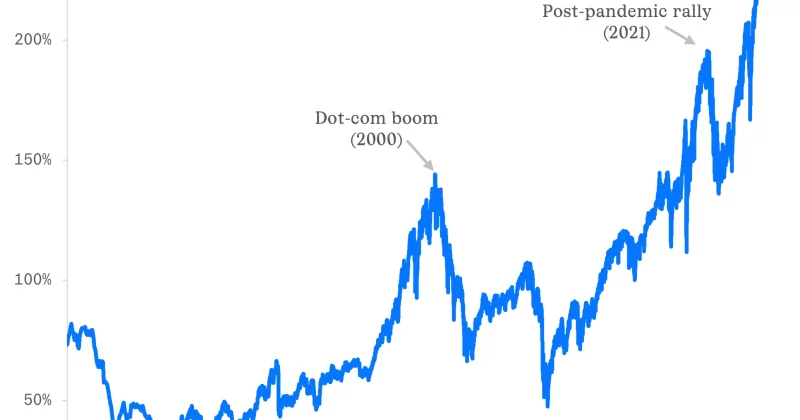
That means US equities are now valued at roughly 2.36 times the country’s entire economic output. For context, the same metric peaked somewhere between 145% and 159% during the dot-com bubble. The current reading isn’t just above that. It’s roughly 50% higher.

What the Buffett Indicator actually measures

Think of it like a price-to-earnings ratio, but for the entire country. Instead of comparing one company’s stock price to its earnings, you’re comparing the total value of all publicly traded US stocks to the nation’s GDP. When the number is high, it suggests stocks are expensive relative to what the economy actually produces.

Buffett popularized this approach in a 2001 Fortune article, back when the wreckage of the dot-com bust was still smoldering. He argued that the ratio offered a clean, broad-stroke view of whether the market had gotten ahead of itself. His warning at the time: readings above 200% mean investors are “playing with fire.”

Advertisement

We’re now 36 percentage points past that threshold.

Financial tracking platform GuruFocus reported a reading of 235.9% on May 29. MacroMicro logged 237.33% the day before. Both figures represent all-time highs. The indicator sat at approximately 229.5% in April and hovered around 225% to 228% from late 2025 through the spring.

Current readings are roughly two standard deviations above historical averages.

Why it’s this high

The primary driver is straightforward: stocks have been on a prolonged tear. Enthusiasm around artificial intelligence has supercharged equity valuations across the tech sector and beyond, pushing market capitalizations to levels that GDP growth simply hasn’t matched.

Here’s the thing. GDP measures what the US economy produces domestically. Many of the largest US-listed companies, the ones driving market cap higher, earn substantial revenue overseas. The Buffett Indicator doesn’t account for those international earnings, which means it can structurally overstate how expensive the market looks when multinational corporations dominate the index.

It also doesn’t factor in interest rates. When rates are low, future corporate earnings are worth more in present-value terms, which justifies higher stock prices. When rates are elevated, the math works differently. The indicator treats both environments the same, which is a limitation worth acknowledging.

What this means for investors

The Buffett Indicator has been above 150% for years now. But the metric isn’t designed to time markets. It’s designed to contextualize risk. And the context right now is that US equities are priced for a level of perfection that leaves almost no margin for error.

For crypto investors specifically, the Buffett Indicator shows no direct correlation with cryptocurrency markets. If stock valuations compress while crypto trades on its own cycle, digital assets could either serve as an uncorrelated hedge or get caught in a broader risk-off liquidation, depending on the nature of the selloff.

Buffett himself said 200% was playing with fire. At 236%, the fire is getting closer.

Disclosure: This article was edited by Editorial Team. For more information on how we create and review content, see our Editorial Policy.

Warren Buffett Indicator reaches record 236%, surpassing dot-com peak by a wide margin

Warren Buffett Indicator reaches record 236%, surpassing dot-com peak by a wide margin

The legendary investor's favorite valuation metric now shows US stocks are worth 2.36 times GDP, well past the level Buffett himself said meant 'playing with fire.'

The stock market valuation metric that Warren Buffett once called “probably the best single measure of where valuations stand at any given moment” just hit a number that would make even the Oracle of Omaha uncomfortable. The Warren Buffett Indicator, which measures total US stock market capitalization relative to GDP, has climbed to 236%.

That means US equities are now valued at roughly 2.36 times the country’s entire economic output. For context, the same metric peaked somewhere between 145% and 159% during the dot-com bubble. The current reading isn’t just above that. It’s roughly 50% higher.

What the Buffett Indicator actually measures

Think of it like a price-to-earnings ratio, but for the entire country. Instead of comparing one company’s stock price to its earnings, you’re comparing the total value of all publicly traded US stocks to the nation’s GDP. When the number is high, it suggests stocks are expensive relative to what the economy actually produces.

Buffett popularized this approach in a 2001 Fortune article, back when the wreckage of the dot-com bust was still smoldering. He argued that the ratio offered a clean, broad-stroke view of whether the market had gotten ahead of itself. His warning at the time: readings above 200% mean investors are “playing with fire.”

Advertisement

We’re now 36 percentage points past that threshold.

Financial tracking platform GuruFocus reported a reading of 235.9% on May 29. MacroMicro logged 237.33% the day before. Both figures represent all-time highs. The indicator sat at approximately 229.5% in April and hovered around 225% to 228% from late 2025 through the spring.

Current readings are roughly two standard deviations above historical averages.

Why it’s this high

The primary driver is straightforward: stocks have been on a prolonged tear. Enthusiasm around artificial intelligence has supercharged equity valuations across the tech sector and beyond, pushing market capitalizations to levels that GDP growth simply hasn’t matched.

Here’s the thing. GDP measures what the US economy produces domestically. Many of the largest US-listed companies, the ones driving market cap higher, earn substantial revenue overseas. The Buffett Indicator doesn’t account for those international earnings, which means it can structurally overstate how expensive the market looks when multinational corporations dominate the index.

It also doesn’t factor in interest rates. When rates are low, future corporate earnings are worth more in present-value terms, which justifies higher stock prices. When rates are elevated, the math works differently. The indicator treats both environments the same, which is a limitation worth acknowledging.

What this means for investors

The Buffett Indicator has been above 150% for years now. But the metric isn’t designed to time markets. It’s designed to contextualize risk. And the context right now is that US equities are priced for a level of perfection that leaves almost no margin for error.

For crypto investors specifically, the Buffett Indicator shows no direct correlation with cryptocurrency markets. If stock valuations compress while crypto trades on its own cycle, digital assets could either serve as an uncorrelated hedge or get caught in a broader risk-off liquidation, depending on the nature of the selloff.

Buffett himself said 200% was playing with fire. At 236%, the fire is getting closer.

Disclosure: This article was edited by Editorial Team. For more information on how we create and review content, see our Editorial Policy.