
Cardano Price Analysis ADA / USD: Deteriorating State
ADA doesn't look well on both timeframes.
- Cardano has a bearish short-term trading outlook, with the ADA / USD pair still trading below critical technical support
- The four-hour time frame is showing that a bearish breakout from a triangle pattern has occurred
- The daily time frame continues to show an extremely large inverted head and shoulders pattern
Cardano / USD Short-term price analysis
Cardano has a bearish short-term trading outlook, with the cryptocurrency declining below critical technical support on the four-hour time frame.
The four-hour time frame is showing that a bearish breakout from a triangle pattern has occurred, although downside momentum is currently subdued.
Technical indicators across the four-hour time frame have a slight bearish bias.
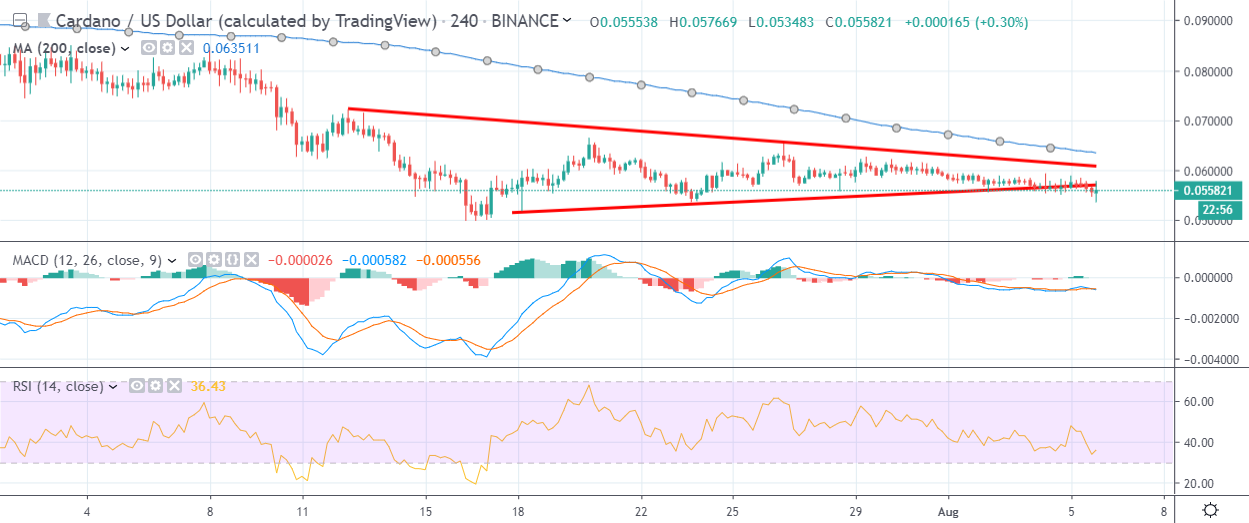
Pattern Watch
Traders should continue to monitor price closes around the triangle pattern on the four-hour time frame to determine the directional bias of the ADA / USD pair.
Relative Strength Index
The RSI indicator remains bearish on the four-hour time frame and continues to trade below neutral.
MACD Indicator
The MACD indicator on the four-hour time frame is neutral and is currently failing to generate a clear trading signal.
Cardano / USD Medium-term price analysis
Cardano has a bearish medium-term trading outlook, with the cryptocurrency weakening below its 200-day moving average.
The daily time frame continues to show a valid inverted head and shoulders pattern, with the ADA / USD pair slipping further away from the neckline of the large bullish pattern.
Technical indicators on the daily time frame are bearish and still show scope for further downside.
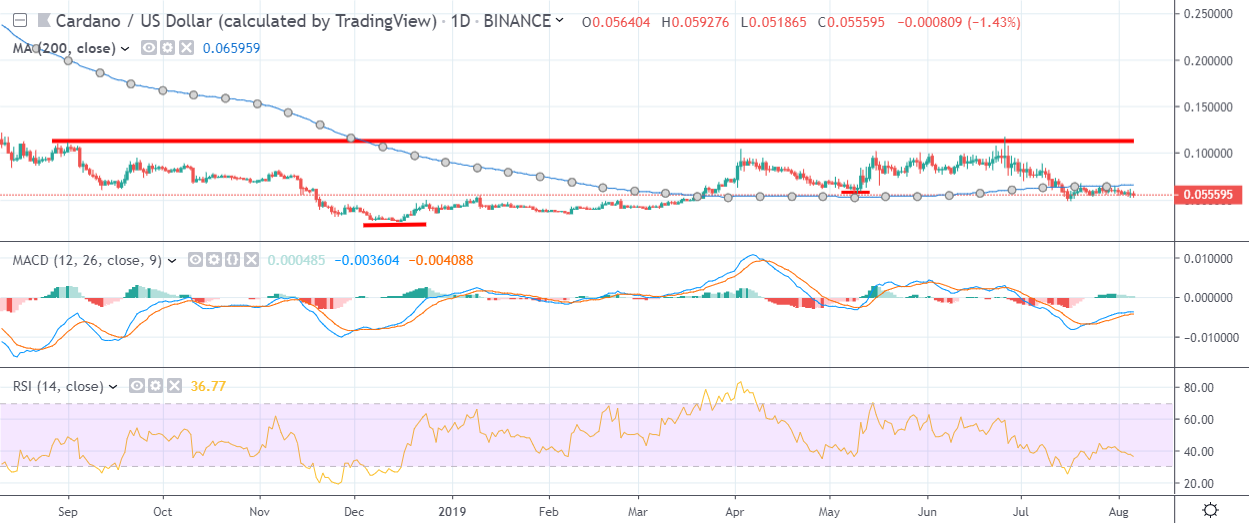
Pattern Watch
Traders should note that a small inverted head and shoulders pattern has now been invalidated on the daily time frame.
Relative Strength Index
The RSI indicator is bearish on the daily time frame and still has scope for further downside
MACD Indicator
The MACD indicator on the daily time frame is bearish and is currently generating a sell signal.
Conclusion
Cardano’s technical outlook is worsening across the four-hour and daily time frame, with the ADA / USD pair starting to trade below a triangle pattern.
The daily time frame also highlights that persistent weakness below the ADA / USD pair’s 200-day moving average has started to shift the medium-term sentiment towards the cryptocurrency.
Check out our coin guide for the Cardano project.
Cardano also received the DARE treatment, a full analysis of its merits and challenges.