
Cardano Price Analysis ADA / USD: Heading Down
ADA could soon establish a new 2019 trading low.
- Cardano has a bearish short-term trading outlook, with the ADA / USD pair falling to its lowest level since March 2019
- The four-hour time frame is showing that a strong bearish breakout from a triangle pattern has occurred
- The daily time frame shows an invalidated inverted head and shoulders pattern
Cardano / USD Short-term price analysis
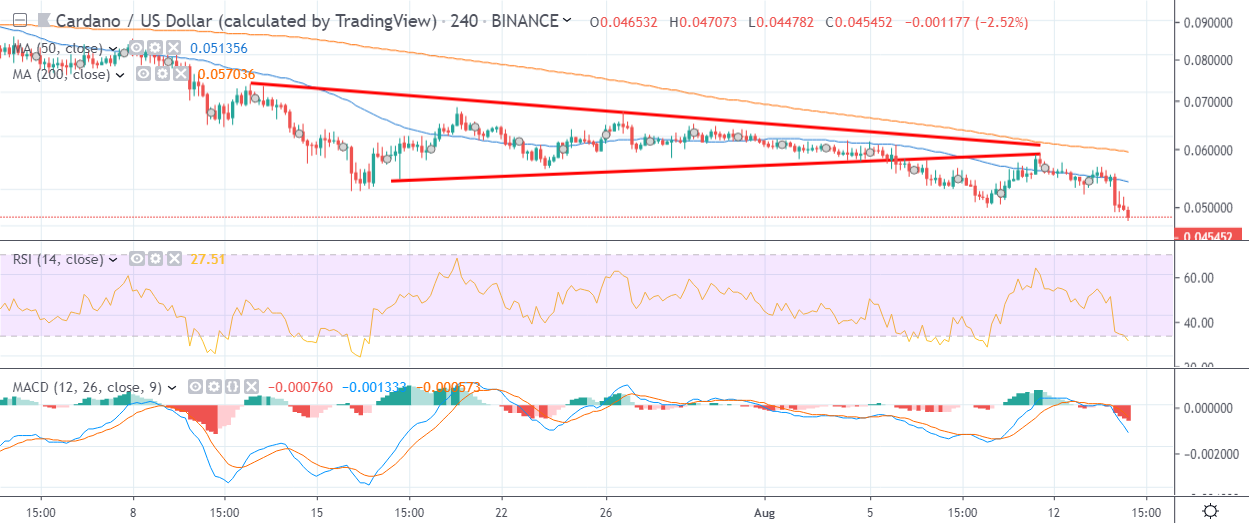
Cardano has a bearish short-term trading outlook, with the cryptocurrency trading below all major technical support on the four-hour time frame.
The four-hour time frame is showing that ADA / USD selling momentum is starting to pick-up, following a bearish breakout from a well-defined triangle pattern.
Technical indicators across the four-hour time frame are turning lower and continue to issue strong sell signals.
Pattern Watch
Traders should note that the $0.030000 level is the overall bearish target of the triangle breakout.
Relative Strength Index
The RSI indicator remains bearish on the four-hour time frame and continues to turn lower.
MACD Indicator
The MACD indicator on the four-hour time frame is heavily bearish and continues to issue a sell signal.
Cardano / USD Medium-term price analysis
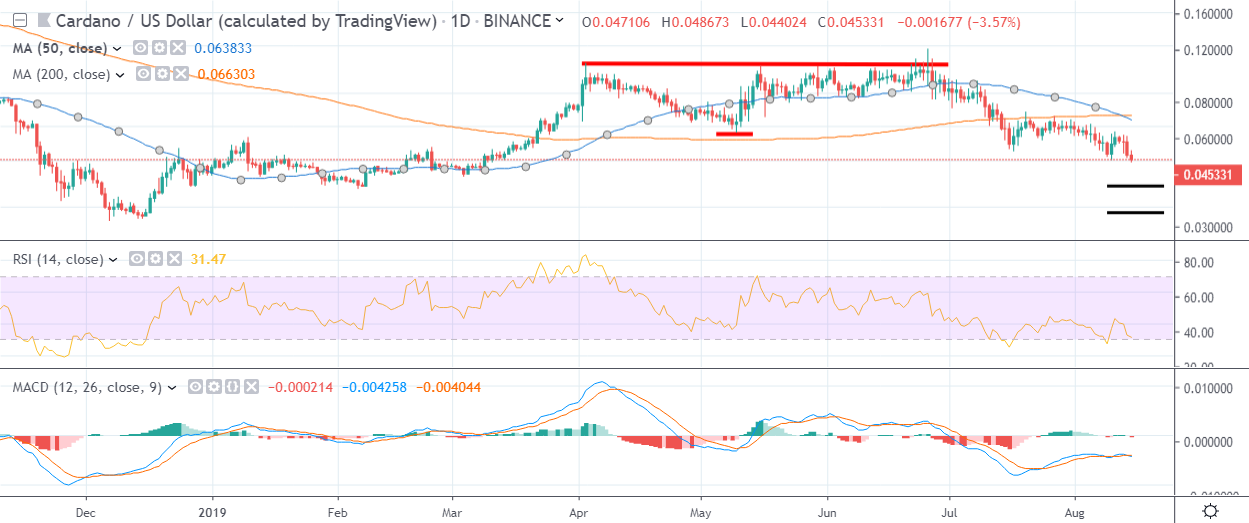
Cardano has a bearish medium-term trading outlook, with the cryptocurrency tumbling to its weakest trading level since March 2019.
The daily time frame shows that an inverted head and shoulders pattern has officially been invalidated, which is encouraging medium-term technical selling.
Technical indicators on the daily time frame are bearish and still show scope for further downside.
Pattern Watch
Traders should note that the bearish target of the invalidated inverted head and shoulders pattern on the daily time frame extends beyond the current 2019 trading low.
Relative Strength Index
The RSI indicator is bearish on the daily time frame and still has scope for further downside.
MACD Indicator
The MACD indicator on the daily time frame is so far failing to provide a clear trading signal.
Conclusion
Cardano continues to descend lower after breaking below a well-defined triangle pattern on the four-hour-time frame and invalidating the inverted head and shoulders pattern on the daily time frame.
Both time frames suggest that the cryptocurrency could soon be headed to a fresh 2019 trading low.
Check out our coin guide for the Cardano project.
Cardano also received the DARE treatment, a full analysis of its merits and challenges.