
Cardano Price Analysis ADA / USD: Ricocheting Up
Cardano has staged a post-dip recovery.
- Cardano has a bullish short-term trading bias, with the cryptocurrency staging a strong recovery from its 200-period moving average on the four-hour time frame
- The four-hour time frame is now showing multiple bullish inverted head and shoulders patterns
- The daily time frame is showing an extremely large inverted head and shoulders pattern
Cardano / USD Short-term price analysis
Cardano has a bullish short-term trading bias, with the cryptocurrency staging a strong recovery from its 200-period moving average on the four-hour time frame.
The four-hour time frame is showing that the ADA / USD pair is attempting to ignite a small inverted head and shoulders pattern, while an even larger bullish pattern remains valid on the mentioned time frame.
Technical indicators on the four-hour time frame have turned bullish and continue to issue a buy signal.
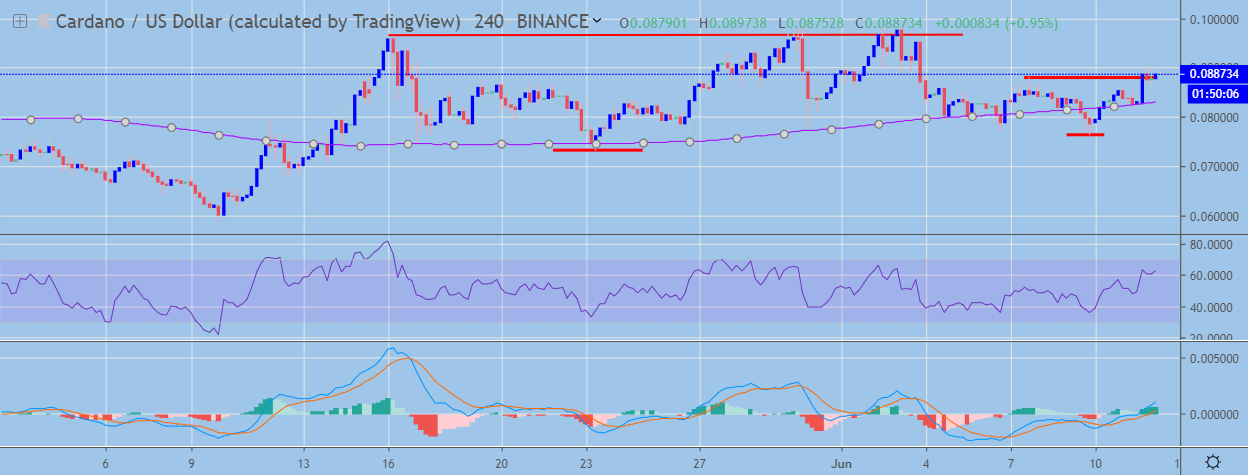 ADA / USD H4 Chart by TradingView
Pattern Watch
Traders should note that the initial upside target of the inverted head and shoulders pattern on the four-hour time frame is the August 6th, 2018 trading high.
Relative Strength Index
The RSI indicator is also bullish on the four-hour time frame and shows scope for further upside advancement.
MACD Indicator
The MACD indicator on the four-hour time frame has turned bullish and is issuing a strong buy signal.
Cardano / USD Medium-term price analysis
Cardano has a bullish medium-term trading outlook, with the cryptocurrency attempting to move back towards the current monthly trading high.
The daily time frame also shows multiple valid inverted head and shoulders patterns, with the July 2018 trading high the overall target of the largest bullish pattern.
Technical indicators on the daily time frame are turning bullish and are starting to issue a buy signal.
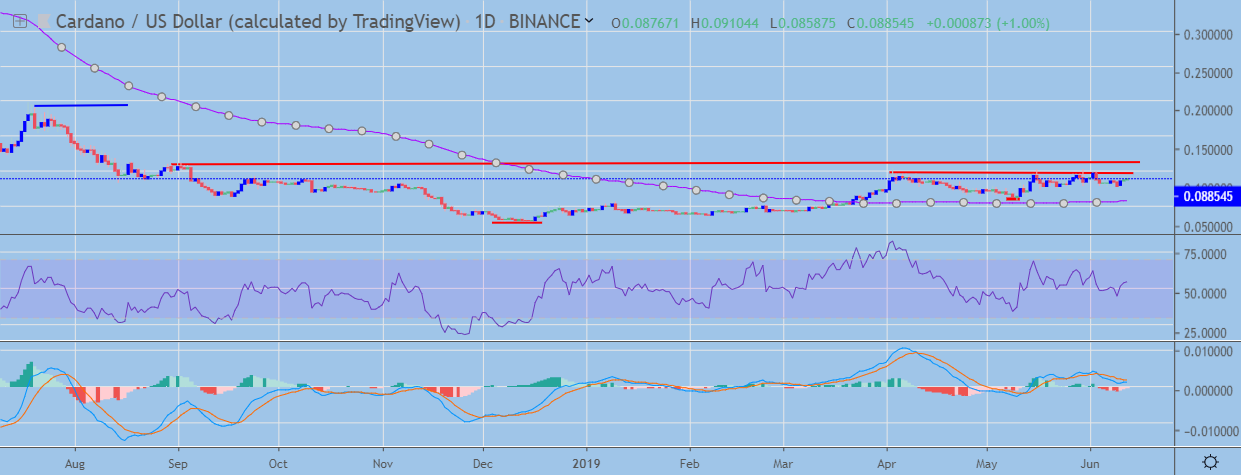 ADA / USD Daily Chart by TradingView
Pattern Watch
Traders should note that the August 2018 trading high is the overall upside target of the smaller inverted head and shoulders pattern on the daily time frame.
Relative Strength Index
The RSI indicator has turned bullish on the daily time frame and shows scope for further upside.
MACD Indicator
The MACD indicator on the daily time frame is starting to turn bullish, with both the MACD signal line and histogram showing significant upside potential.
Conclusion
Cardano has staged a strong technical rebound from key support on the four-hour time frame, highlighting the growing dip-buying demand from the cryptocurrency.
Both time frames show far-reaching upside targets, with the ADA / USD pair now needing to break above key neckline resistance to trigger its next bullish advance.
Check out our coin guide for the Cardano project.
Cardano also received the DARE treatment, a full analysis of its merits and challenges.