Cardano Price Analysis ADA / USD: Smashing The Ceiling?
Cardano is looking to perform a bullish breakout.
- Cardano has a bullish short-term bias, with the cryptocurrency testing towards the best levels of 2019 so far
- The four-hour time frame is now showing that a bullish ascending triangle pattern has formed
- The daily time frame continues to show a bullish inverted head and shoulders pattern
Cardano / USD Short-term price analysis
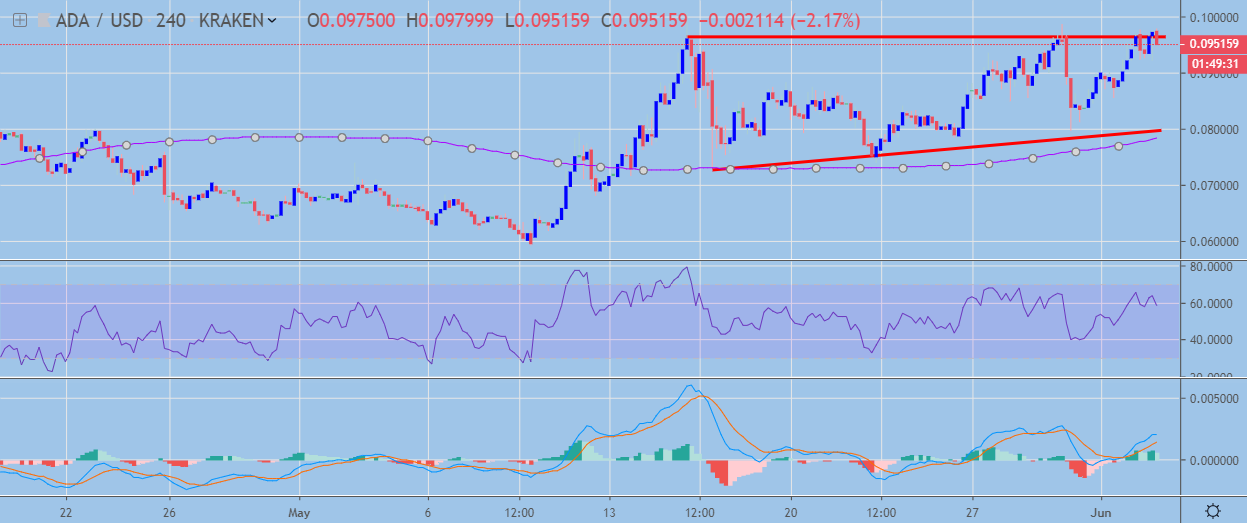
Cardano has a bullish short-term trading bias, with the cryptocurrency staging a strong recovery back towards its current 2019 trading high.
The four-hour time frame is showing that an ascending triangle pattern has formed, with ADA / USD buyers now testing towards the top of the bullish pattern.
Technical indicators on the four-hour time frame have turned bullish alongside the recent strong recovery in the ADA / USD pair.
 ADA / USD H4 Chart by TradingView
Pattern Watch
Traders should be on guard for the next strong directional move on the four-hour time frame once a technical breakout from the ascending triangle patterns occurs.
Relative Strength Index
The RSI indicator is also bullish on the four-hour time frame, although the indicator is struggling make a fresh high.
MACD Indicator
The MACD indicator on the four-hour time frame has turned bullish and is continuing to issue a buy signal.
Cardano / USD Medium-term price analysis
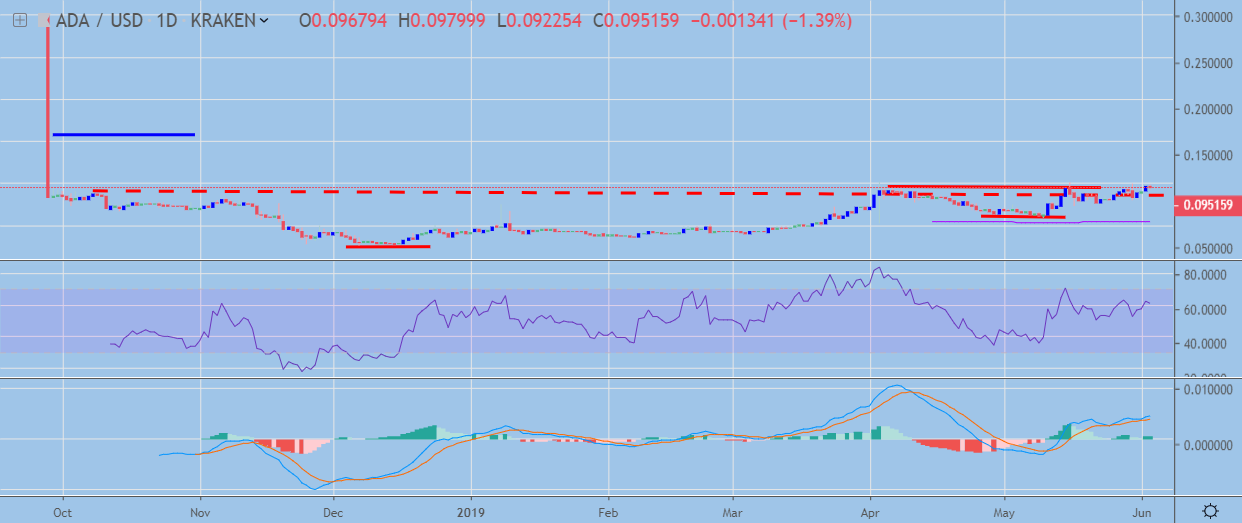
Cardano has a bullish medium-term trading outlook, with the cryptocurrency holding firm above key technical support on the daily time frame.
The daily time frame is now showing the presence of multiple inverted head and shoulders patterns, with both bullish patterns holding sizeable upside projections.
Technical indicators on the daily time frame remain bullish and still have significant scope to trade much higher.
 ADA / USD Daily Chart by TradingView
Pattern Watch
Traders should note that the larger inverted head and shoulders patterns upside projection would take the ADA / USD pair towards levels not seen since October 2018.
Relative Strength Index
The RSI indicator is bullish on the daily time frame and still shows scope to move higher.
MACD Indicator
The MACD indicator on the daily time frame is bullish and continues to issue a buy signal.
Conclusion
Cardano remains very well supported on any technical pullbacks, with the ADA / USD pair close to performing another major technical breakout.
Both time frames continue to show bullish patterns with significant upside potential, while technical indicators highlight that upside pressure is once again building.
Check out our coin guide for the Cardano project.
Cardano also received the DARE treatment, a full analysis of its merits and challenges.