
Chainlink Price Analysis LINK / USD: Against The Flow
Chainlink rising against other tokens, but struggling against overall market gravity.
- Chainlink has a bullish short-term bias, with the LINK / USD pair recovering above its 200-period moving average on the four-hour time frame
- The four-hour time frame is now showing a valid head and shoulders pattern
- The daily time frame is showing that bulls have invalidated a large head and shoulders pattern
Fundamental Notes
Chainlink launched its mainnet on May 31st. Although its price declined soon after the launch, fundamentally LINK remains strong. The project has announced that the first oracles on its platform will be retrieving cryptocurrency market prices and feeding them into smart contracts. Later the project plans to add more oracles to its network, and expand to other blockchains, which should have a positive effect on its ecosystem.
Chainlink / USD Short-term price analysis
Chainlink has a bullish short-term trading bias, with the cryptocurrency staging a strong technical recovery above its 200-period moving average on the four-hour time frame.
The four-hour time frame is now showing the existence of a head and shoulders pattern, with the LINK / USD pair holding above the neckline of the bearish pattern.
Technical indicators on the four-hour time frame are now starting to turn bullish.
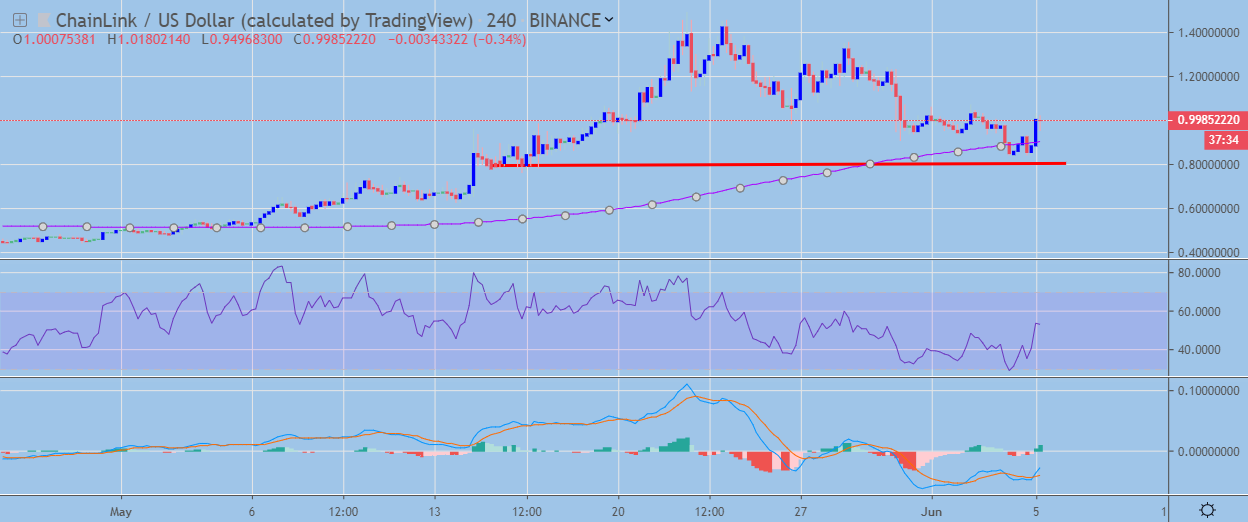 LINK / USD H4 Chart by TradingView
Pattern Watch
Traders should note that the recent move higher in the LINK / USD may help to form a right-hand shoulder to complete the bearish pattern on the four-hour time frame.
Relative Strength Index
The RSI indicator is attempting to turn bullish on the four-hour time frame.
MACD Indicator
The MACD indicator on the four-hour time frame is bullish and is now starting to issue a buy signal.
Chainlink / USD Medium-term price analysis
The LINK / USD pair has a bullish medium-term trading outlook, with the cryptocurrency still trading well above major technical resistance.
The daily time frame is showing that a bullish pattern has now formed after the recent move higher in the LINK / USD pair helped to invalidate a large head and shoulders pattern.
Technical indicators on the daily time frame remain bearish and continue to issue a strong sell signal.
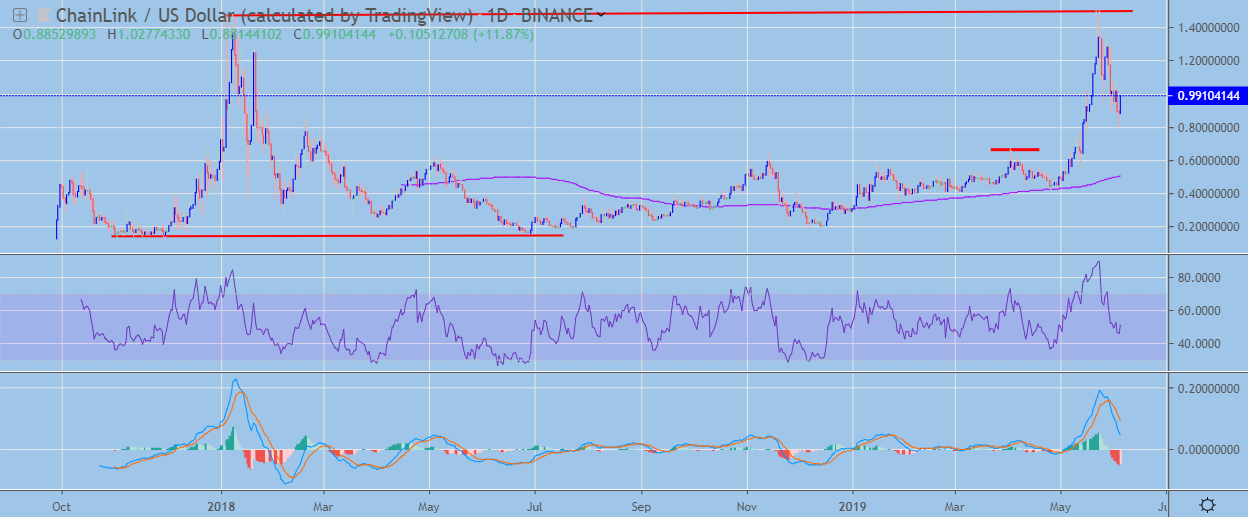 LINK / USD Daily Chart by TradingView
Pattern Watch
Traders should note that the April monthly trading high is now acting as critical technical support on the daily time frame.
MACD Indicator
The MACD indicator on the daily time frame remains bearish, with both the MACD signal line and MACD histogram issuing a sell signal.
Relative Strength Index
The RSI indicator on the daily time frame is also bearish and continues to issue a sell signal.
Conclusion
Chainlink is starting to rebound higher after finding strong buying interest from its 200-period moving average on the four-hour time frame.
LINK / USD bulls now need to invalidate the bearish pattern on the four-hour time frame in order to avoid the possibility of a much deeper technical correction.
Check out our coin guide for Chainlink to learn more about the project.