
Atom price analysis may 30
Cosmos Price Analysis ATOM / USD: Liftoff
Today's uptick is impressive, but merely a blip on the daily chart.
- Cosmos has a bullish short-term outlook, with the cryptocurrency challenging towards its all-time price high
- A bullish breakout is currently underway on the four-hour time frame
- The daily time frame is showing that the ATOM / USD pair is trading within a rising price channel
Cosmos / USD Short-term price analysis
Cosmos has a bullish short-term outlook, with the ATOM / USD pair challenging towards its all-time trading high.
The four-hour time frame is showing that a major technical development has occurred, with the cryptocurrency breaking above a large triangle pattern.
Technical indicators on the four-hour time frame are bullish and continue to issue a strong buy signal.
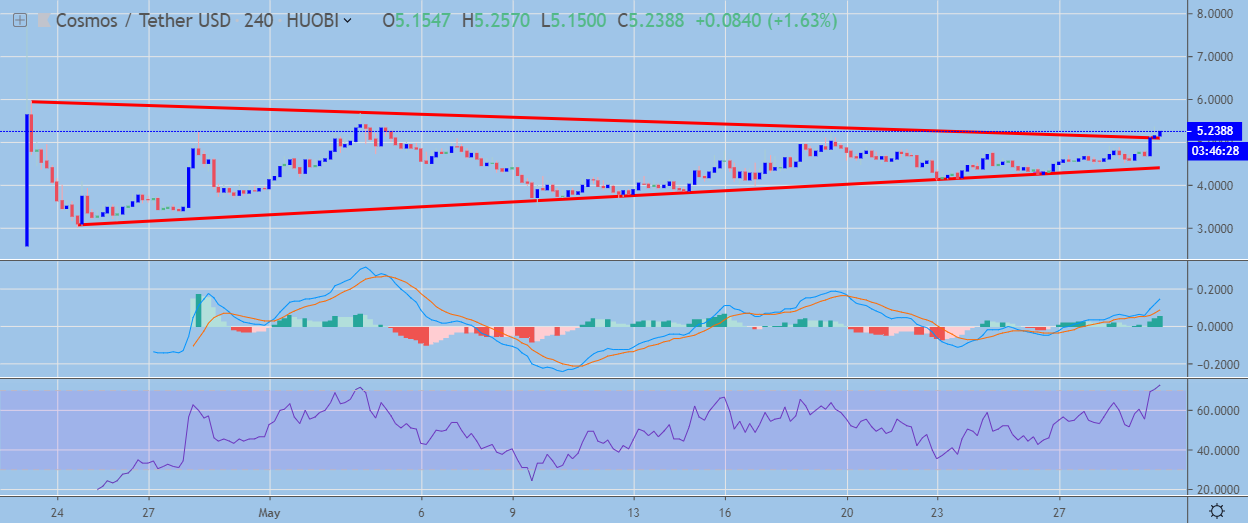 ATOM / USD H4 Chart by TradingView
Pattern Watch
Traders should continue to monitor price closes above the triangle pattern on the four-hour time frame for further technical confirmation.
Relative Strength Index
The RSI indicator on the four-hour time frame is bullish, although it has approached extreme overbought territory.
MACD Indicator
The MACD indicator is bullish on the four-hour time frame and continues to generate a buy signal.
Cosmos / USD Medium-term price analysis
Cosmos has a neutral medium-term trading bias, with the cryptocurrency still trapped within its recently established price range.
The daily time frame is showing that the ATOM / USD pair is currently trading within a rising price channel, with the cryptocurrency bouncing from key trendline support.
Technical indicators on the daily time frame are bullish and continue to generate buy signals.
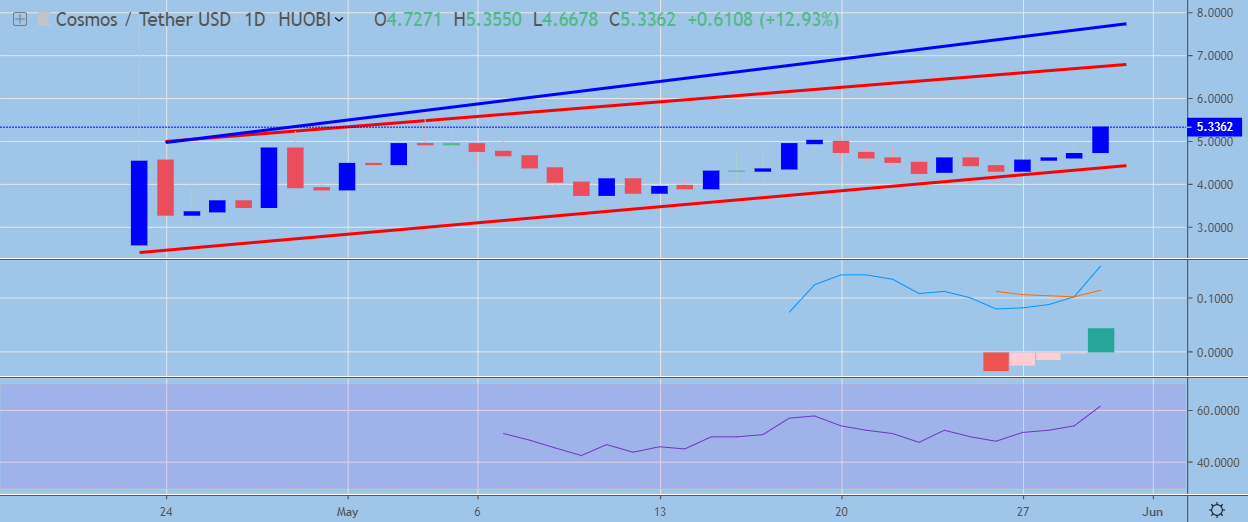 ATOM / USD Daily Chart by TradingView
Pattern Watch
Traders should note that the cryptocurrency may start to attack towards key trendline resistance on the daily time frame.
Relative Strength Index
The RSI indicator is also bullish on the daily time frame and shows scope for further upside.
MACD Indicator
The MACD indicator on the daily time frame has turned bullish and shows scope for further upside.
Conclusion
Cosmos has an increasingly bullish short-term outlook, with the breakout on the four-hour time frame providing a strong indication that cryptocurrency could start to move into a much higher price range.
The recent bounce from key trend line support on the daily time frame also suggests bullish momentum is starting to grow over the medium-term.